AN EXODUS TO WHERE?
Hello and thanks for reading this week’s edition of the No Straight Lines Investments blog, I am truly grateful.
The DXY closed below the 100 level and is down 8.5% on the year.
Charts from Rich Ross, EvercoreISI
I suspect it is well understood by now that the occurrence of yields up/dollar down is an indication of investors selling down exposure to the U.S. generally.
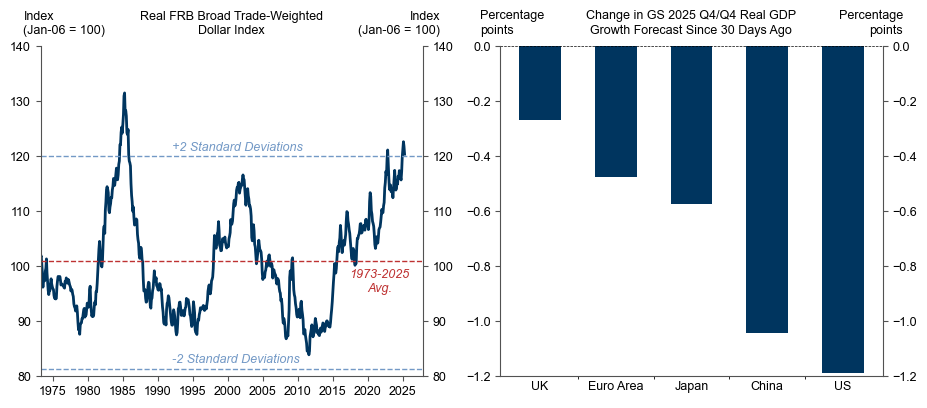
Source: FRB, Haver Analytics, GSGIR
I am sharing these last two charts as the technician, (Rich Ross) is suggesting the DXY has bottomed, whilst GS FX strategists are suggesting the DXY is 20% overvalued, which is being compounded by the relatively larger negative revisions to U.S. growth.
We can debate whether it is an expression of concern about U.S. policy and it’s implications, or simply an overdue reset after a decade + of global investors buying into (and being rewarded for it) U.S. exceptionalism:
Source: EPFR, GSGIR
How many of us would look at this chart and conclude: Yep, that looks sustainable? And check out the timeframe, that is only the past 3 and a bit years!
The other unusual aspect of this most recent drawdown has been the conspicuous lack of build in cash balances:
Source: EPFR, Haver Analytics, GSGIR
So what does it all mean?
And if investors are reducing exposure to the U.S., what are the better options for investment $$?
If you would like to continue reading, please subscribe for $20/month:
If this is it, thanks for reading and best of luck with your investments.
You can follow me on X (@NSLInvestments), LinkedIn: Jonathan Lansky, or using the Chat feature on Substack. YouTube channel launching soon.


