

BIG TECH BETTER BEAT BOOMING ESTIMATES
BIG TECH BETTER BEAT BOOMING ESTIMATES

Hello and thanks again for reading this week’s edition of the No Straight Lines Investments blog.
Stock operators continued to recalibrate positioning based on the higher-for-longer narrative this week in equities.
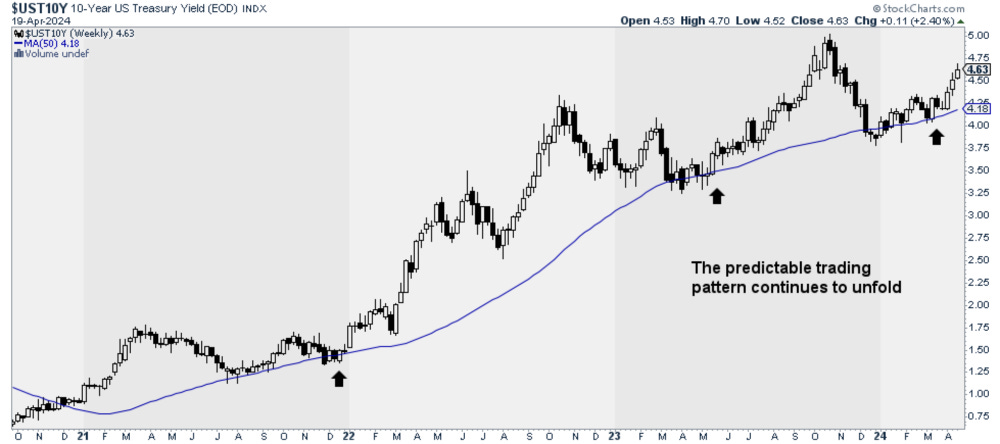
The 10-year treasury captures a great deal of the weekly mood which is why I keep posting it. I would point out that we didn’t end the week on it’s high, which could be considered somewhat constructive.
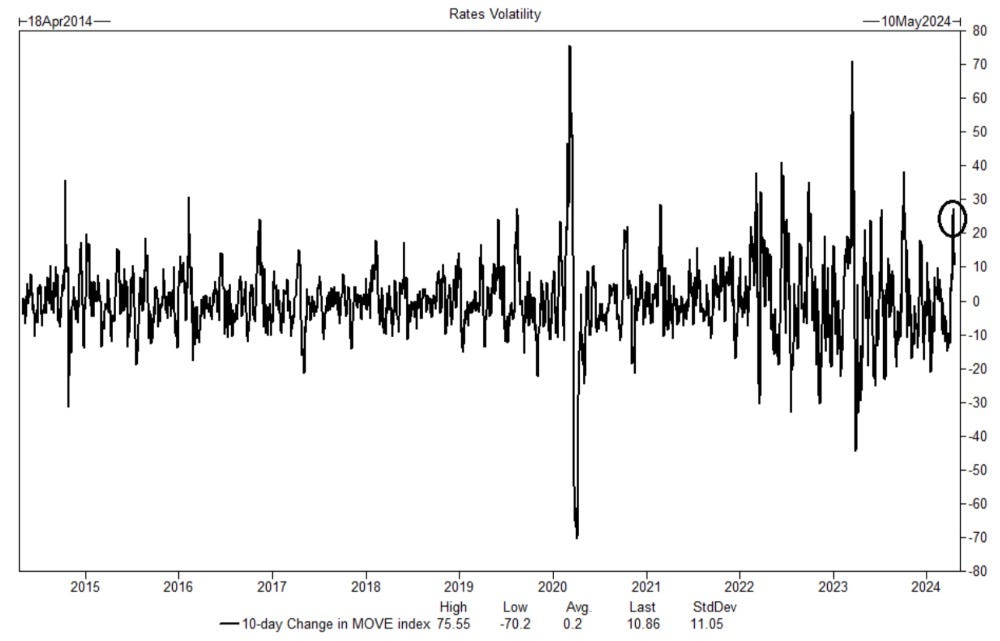
Rate volatility, as charted by the MOVE index above (chart from Erin Briggs GS), has increased considerably since April 1. In fact, the 27 point increase from April 1-April 15 is one of the largest over the past decade. No surprise that equities are choppy.
In an attempt to neatly summarize the week:
Chair Powell (and other members of the Fed) reinforced market pricing of 2 cuts based on the idea of allowing further time for restrictive policy to work.
Economic data remains firm and suggestive of continuing US economic momentum, in spite of restrictive interest rates.
With the SPX now down 3 weeks consecutively, the equity market is dealing with systematic supply ($26B in the week ahead according to GS), geopolitical repositioning, no bid from buybacks due to earnings blackout and the ever present traders instinct to sell winners to preserve still solid gains.
Q1 earnings so far have been decent with 14% of SPX in the books, but this week is the big week with 37% of the S&P reporting, including META/GOOGL/MSFT. We already know how critical mega cap technology is to overall SPX earnings so the bar is high, hence the title of the blog. To set the table properly, the expected growth, respectively, is 96%/30%/15% . Also worthy of mention is that the top 10 SPX names have 32% embedded growth against 4% earnings decline for the 490 according to GS. No pressure!
In short, we need Q1 earnings to provide enough incentive for the bottom up crowd to buy the results until the buybacks can provide more of a demand offset to the supply highlighted above.
The final fly in the ointment is the overarching question of whether the 5% pullback is due for a bounce or will become a 10% correction? Mike Santoli of CNBC points out that historically 40% of 5% pullbacks turned into 10% corrections. Feel better?
Here’s a history of the 5% pullbacks from SPX highs and why, a great summary from Charlie Bilello:
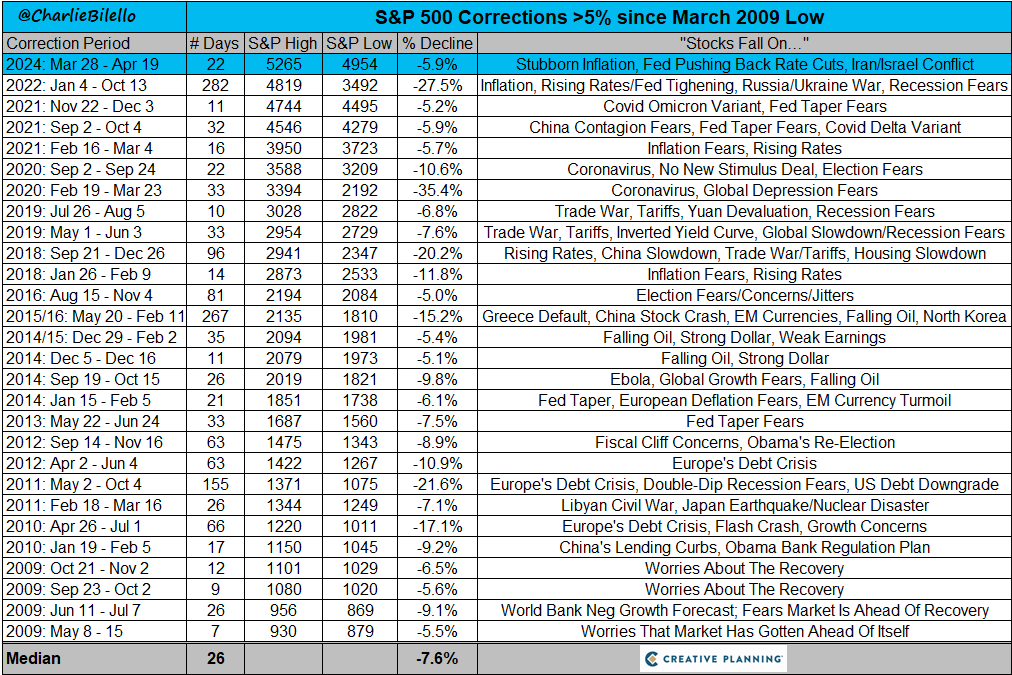
This is SUPER interesting to me, it’s always something.
Let’s dig in to the week’s key releases and events, shall we?
US RETAIL SALES - CONSUMER STRENGTH PERSISTS
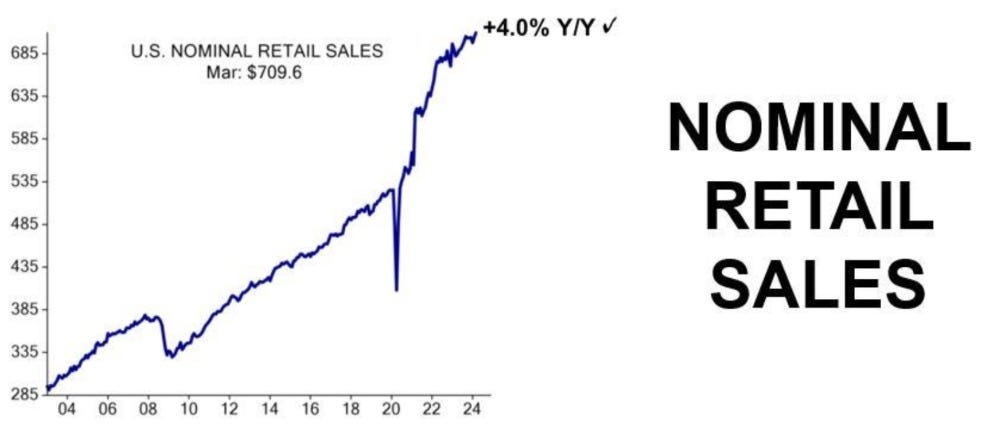
US retail sales clocked in at 0.7%, well ahead of consensus of 0.4% and demonstrate the continued resilience of the US consumer, driven by the strong jobs market and likely also due to the stock market wealth effect.
With March results now in, Q1 consumer spending is on track for 3%+ gain.
The GDPNow estimate sits at 2.9%, which is above the consensus forecast of 2.1%. Q1 GDP will be released on April 25.
The stronger retail sales result is indicative of a resilient US economy and reinforced the market perception that the Fed can be patient with rate cuts.
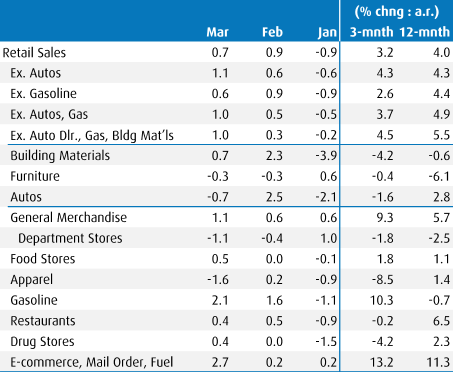
Here’s a more detailed table of the retail sales release (from BMO) for those that want to dig deeper:
FED - JPOW DELIVERS AN INLINE RESET
With interest rate futures already reflecting an expectation of only two cuts for 2024, all that was left was for JPow to confirm the “correctness” of this pricing.
Here’s Krishna Guha of EvercoreISI’s take on what he heard from the Fed Chairman:
We view this as a measure hawkish reset of policy communication to a more neutral posture with less of an immediate bias to cut rates, though the basic idea of wanting to get more confidence inflation is moving lower before cutting rates remains intact.
But what has not changed is Powell’s read of the underlying economics, and this prevents us from reading him too hawkish overall.
Powell argued that strong growth is not leading the US economy to overheat, again embracing the idea - key to our analysis - of a positive supply side surprise with the labour market “strong” but still “moving into a better balance” with wages “continuing to moderate” Krishna Guha, EvercoreISI April 16
As further support to the better balance in the labour market, Jan Hatzius of GS provided these 2 graphics in a note to clients last week:

As you can see the Jobs/Workers gap is down to 2mm and different measures of wage growth are pointing to 4%.
Hatzius and team expect wage growth to migrate to 3.5%. With an assumed 1.5% productivity gain, this would be a level consistent with 2% inflation.
Mr. Hatzius has been the most accurate of the economists over the past couple years, so I will give him the benefit of the doubt.
Chair Powell and other Fed members reinforced the push out of rate cut expectations in the market place. We will see PCE on Friday of this week, consensus is expecting a core reading of 0.27%.
Rate cut expectations are not currently a tailwind to the market.
CANADA CPI - IS THE 3RD TIME THE CHARM?
Canadian inflation surprised to the downside for the 3rd consecutive reading. Basically the polar opposite of the inflation picture in the US.
Here are the details with thanks to BMO’s Douglas Porter:

As Mr. Porter pointed out, 3 of the 4 measures of core inflation are now <3% for the first time since the summer of 2021.
The 3-month annualized measures of the BofC’s preferred gauges, Trim and Median look very promising at 1.4% and 1.1% respectively.
Shelter inflation remains stubborn at 6.5%, but the vaunted mortgage interest increases will begin to decline on year/year comparisons.
In his joint presser with Fed Chair Powell, Tiff Macklem acknowledged further progress on the inflation front.
Barring a major negative inflation surprise, Canada will get it’s first rate cut in June. All else equal, this is risk supportive.
Notwithstanding a misguided move by the Canadian government to increase capital gains taxes, I still believe the TSX is positioned to provide healthy returns due to it’s large weighting in energy/materials. At a minimum there is good hunting in those specific sectors.
It is interesting that the salesfolk at GS are advocating allocation to mining/energy/commodities along with favourite TMT stocks. This is a recent shift in thinking. Music to my ears!
CHINA GDP - Q1 STRONGER THAN ANTICIPATED

Graph from Neo Wang of EvercoreISI.
Q1 GDP clocked in at 5.3% y/y, well ahead of consensus of 4.3%.
Infrastructure, which is where stimulus measures have been directed thus far, was the real bright spot in the report, with continued weakness in anything housing related.
Some commentators expressed concern about the slowdown in March relative to Jan/Feb.
Expectations around China are very low. I am paying close attention due to China’s outsized demand in the commodity square, most crucially in copper.
The key point here is that there is no expectation of any sort of acceleration in demand from China for any of the commodities I am currently long (copper/uranium/oil/natural gas).
INITIAL CLAIMS - A STATISTICALLY IMPROBABLE STRING OF RESULTS

Graph from Doublewide Capital
As you can see, initial claims have registered 212k 5 of the past 6 weeks. Going back to 1968, the claims level have been equal in consecutive weeks a total of 89 times, or 3% of the time. The first ever 3peat happened in March of this year.
Be that as it may, the claims data is the best real time gauge of the jobs market. Ed Yardeni believes claims levels remain consistent with the U-rate remaining firmly <4%.
Jobs are the key to the soft landing/no landing narrative. No signs of imminent stress here.
If you wish to read on, please sign up for my monthly subscription of $20/month.
Here’s what’s in store:
Flows Analysis - as I mentioned above, we are in a bit of an air pocket of demand without the presence of buybacks, so $$ flow will be particularly influential over earnings season, on top of the repositioning that is happening in real time due to the Fed extended pause etc.
Charts of the Week - stepping back to check out the technical picture is particularly useful during noisy moments in the market such as the current environment.
Portfolio Stocks - I will provide analysis on 3 positions that reported this week, 2 in the financials and 1 in the industrials. All 3 reported solid earnings ahead of expectations, and all 3 closed UP on the week.
Thanks for reading No Straight Lines Investments, please share with someone you think would enjoy.
You can follow me on X (@NSLInvestments), on LinkedIn or through the Chat feature on Substack.
Good luck this week!