

FED SAYS "NO WORRIES" TO HOTTER INFLATION
FED SAYS "NO WORRIES" TO HOTTER INFLATION

Hello and thank you for joining me for another edition of the No Straight Lines Investments blog.
What a week!
We began the week pondering just how hawkish the FOMC would be following consecutive elevated inflation prints, most prominently shown in the 10-year treasury yield:

As you can see, yields actually declined 9 bps.
So what happened?
In short, JPow turned decidedly dovish, signaling that the FOMC is willing to tolerate slightly higher inflation and remains on track for a June rate cut.
Wow! Didn’t see that coming, and based on the reaction in markets, neither did anybody else.
More on the Fed below.
Meanwhile, the S&P had it’s best week of the year up 2.29%.
The positive action was not limited to the US market; Nikkei 225 was up 5.4%, Stoxx 600 up 1% on dovish central banks (BOJ/BOE/SNB) and overall solid economic data.
My good friend the Bay Street Doctor pointed out the chart of the USD as worthy of analysis:
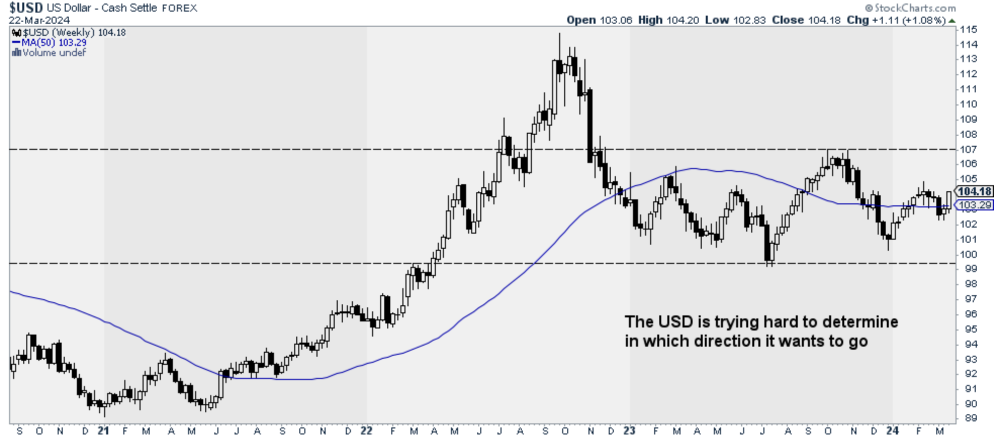
Notable that we saw some modest appreciation in the face of a dovish turn from the Fed. I am keenly watching to see which direction this chart takes us as a weaker USD is supportive of my bull stance on commodities.
Many data points and narratives to explore, on to the week that was.
FOMC - WHEN DOVES FLY
It is exceedingly challenging to truly surprise markets as a central bank. All of the moves are well choreographed/telegraphed as CB’s are not inclined to disturb so called equilibrium in the markets.
Unless the narrative requires a shift.
Enter JPow and the Fed last week.
Given the backdrop of two adverse inflation prints it would be hard to imagine a more bullish-dovish than the one we got from the March FOMC meeting….
The Fed is not inclined to take much signal from the January/February inflation. It thinks the inflation story is “essentially the same: inflation coming down gradually to 2% on a sometimes bumpy path” - though it will have to confirm this in the coming months.
A June start for 3 cuts in 2024 is still the base case and is proving sticky, with the median projection taking out a cut in 2025. Krishna Guha, EvercoreISI March 20, 2024
How is this even possible?
Basically the Fed is assuming that labour supply (read immigration) and productivity gains will continue.
To put it plainly, the Fed is more concerned about cutting too late than it is about cutting too soon.
I can defend this conclusion based on JPow’s dovish stance on FCI, wages, labour market rebalancing and even on the level of policy restraint.
Is there a political aspect to this?
Who can say?
Barring wildly hotter inflation for March/April/May, we are getting our first rate cut in June.
Clearly a tailwind, in particular for capital markets activity.
US FLASH PMI’S - MORE BALANCED GROWTH
I am closely following the manufacturing recovery due to it’s linkage to the performance of copper/steel, as I wrote about last week.
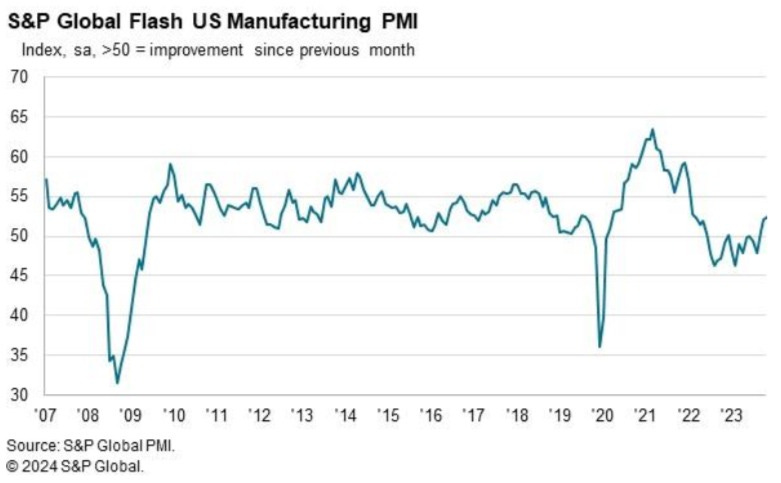
Here’s what Chris Williamson, Chief Business Economist, S&P had to say:
Further expansion of both manufacturing and service sector output in March helped the US economy close off it’s strongest quarter since the 2nd quarter of last year. The survey data point to another quarter of robust GDP growth accompanied by sustained hiring as companies continue to report new order growth.
The brightest news came from the manufacturing sector, where production is now growing at the fastest rate since May 2022. Production gains are linked to improving demand for goods both at home and abroad, driving a further upturn in business confidence in the outlook. Chris Williamson, March 21, 2024
The manufacturing PMI clocked in at 52.5, which is a 21 month high. Not a typo.
Services business activity slowed down to 51.7 from 52.3 in the previous month, but still solidly in expansion.
The most recent GDPNow estimate sits at 2.1%, which doesn’t factor in these survey results.
The manufacturing survey is bullish for materials, without question.
EZ MANUFACTURING PMI - WEAK READING BUT GLIMMERS OF HOPE

Unfortunately we did not see a similar uptick in the EZ Manufacturing PMI, as it came in at 45.7, which was below February’s reading of 46.5.
The devil truly is in the details. An excerpt from the comments of the chief economist at Hamburg Commercial bank:
Output fell at more or less the same pace as in the first two months of the year, and new orders continued their downward trend unabated. However, there is a glimmer of hope. Companies remain optimistic about future production. Moreover, the index of stocks of finished products has risen for the second month in a row and is approaching the point of no change. Reaching this point would mean that destocking would no longer be a drag on production. Cyrus de la Rubia, March 21, 2024
I wanted to include this quote because destocking has been one of the main issues with the copper market. Obviously we need to see this trend continue.
CANADA CPI - NO MORE EXCUSES MR. MACKLEM

Chart courtesy of RBC
Canada’s February inflation report was the stuff of central banker’s dreams at this stage. Have a look at the preferred measures of the BofC, both Trim and Mean clocked in at 2.2% on a 3-month annualized basis, the lowest in 3 years! You can see on the above graph that 3 of the 4 measures are at the 2% threshold now. Given that Tiff Macklem has said they could cut BEFORE inflation hits 2%, I wonder how the BofC can justify NOT cutting.
David Rosenberg wrote an excellent op-ed in the Financial Post: Rosie Piece
The real key in the recently released CPI report was the -0.1% month/month reading in the CPIX, which excludes the 8 most volatile price components as well as indirect taxes. This comes after 2 flattish months and provides the first whiff of deflation since July 2020. The trend in CPI ex-mortgage interest costs was running at 4.7% y/y a year ago and has since melted to 1.9%. This below pre-COVID pace of 2.3%.
Not just that, but if you strip out mortgage interest, which is a statistical source of inflation in the CPI that is actually caused by the BofC, the CPI has shown essentially no net change from August to February. That’s a six month beavertail in prices if you exclude the monthly mortgage payment to the bank. That hasn’t happened since August of 2020, when COVID was raging and the economy was in lockdown. David Rosenberg, March 22, 2024
At a bare minimum, I would expect the BofC to open the door to a rate cut in June when they announce the next rate decision on April 10.
Unlike the Fed, the BofC has seen 2 supportive inflation prints and the Canadian economy, whilst not in a recession, is not performing close to the level of the US economy. I rest my case!
LEI’S - A SHIFT IN TREND?
One of the anchor’s of the “recession is inevitable” camp has been the precipitous decline in the LEI’s.
In fact, the LEI has declined 13% over the past 26 months, and has been 100% accurate in predicting a recession.
February LEI actually ticked UP 0.1%, and continues a trend of moderately improving readings i.e. lower declines. Have a look at the graph from Ed Hyman of EvercoreISI:

Could this be the turn? Stay tuned!
INITIAL CLAIMS - INDICATE A STABLE JOB MARKET
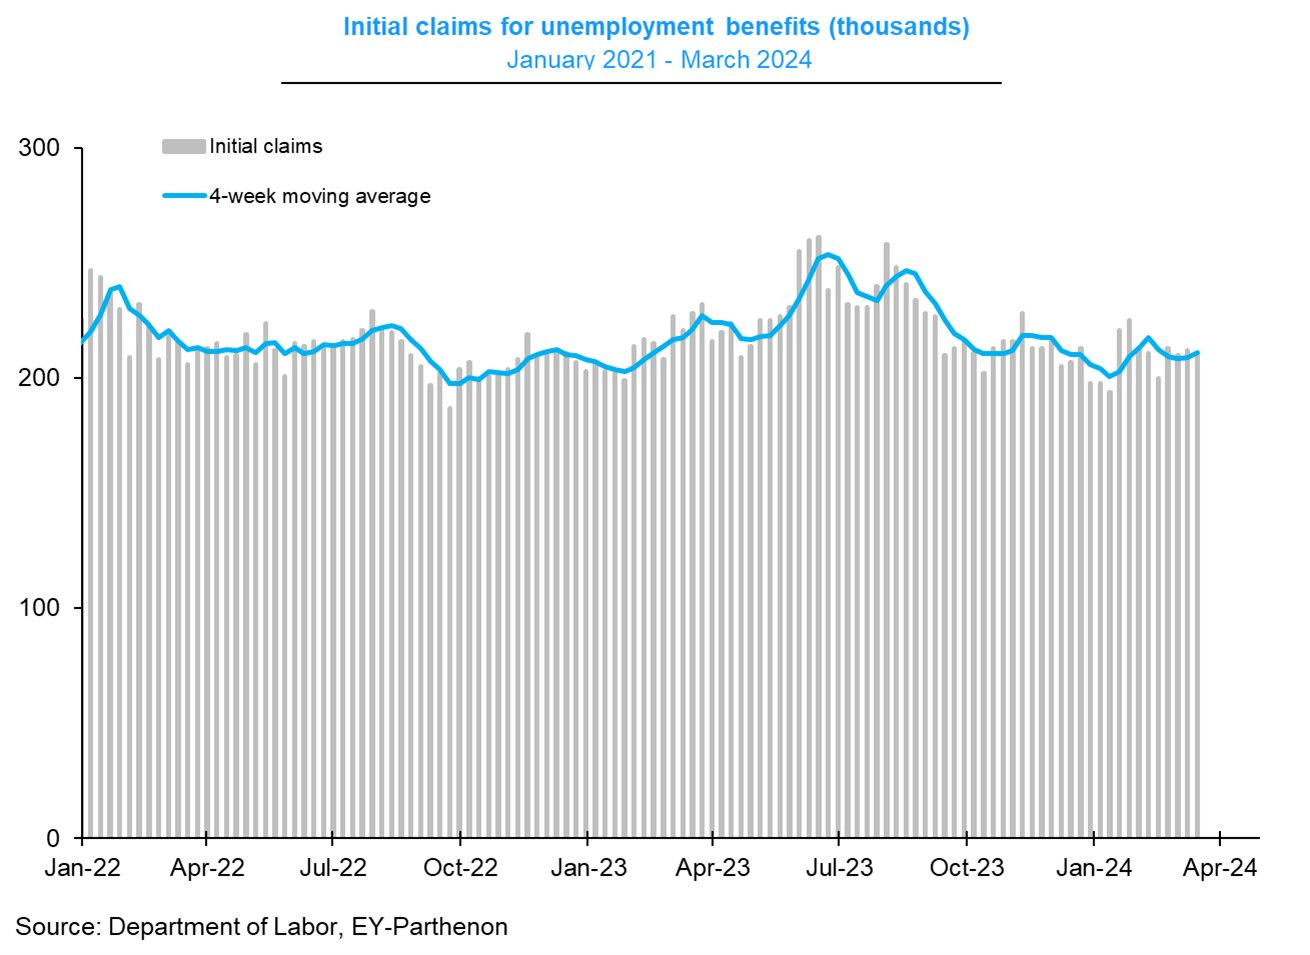
Graph from Greg Daco
Initial claims registered 210k for this week, below expectations for 216k and well below levels indicative of stress in the jobs market (>300k).
If I take a technical eye to this chart, it is showing no sign of breaking in either direction. This is very good news for the soft landing camp.
BofE - MARGINALLY DOVISH RATE DECISION
The members of the MPC voted 8-1 to hold rates.
On the surface this wouldn’t qualify as dovish, however, this is the first time since September of 2021 that no member voted for a hike.
The single vote for a cut was from member Dhingra.
UK CPI - EVERY VICTORY COUNTS

Core inflation came in at 4.5%, which was 0.1% better than expectations. We’ll take that.
You will notice in the graph above (thank you Krishna Guha EvercoreISI) that services inflation remains elevated, at 6.1% y/y, slightly ahead of expectations.
The inflation print, which came out a day ahead of the BofE decision, essentially reinforces the view that MORE DATA REQUIRED to confirm that inflation is durably on track toward 2%.
CANADA RETAIL SALES - NOT AS WEAK AS FEARED
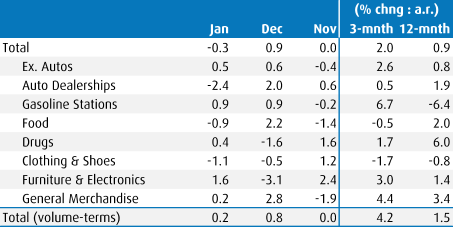
I’ll make this quick. Chart courtesy of BMO.
Retail sales for January were a tick better at -0.3%, versus the preliminary Statscan estimate of -0.4%.
And the February preliminary estimate if for a 0.1% gain.
The decline in auto sales was the first in 5 months, and sales ex-autos were up for consecutive months.
The picture isn’t great, but the Canadian consumer is hanging in there.
The report shouldn’t dissuade the BofC from cutting rates sooner rather than later.
This is it for the free portion of this week’s blog. I have a tonne of interesting commentary to share with you if you decide to continue reading:
Flow Analysis - along with the always fascinating breakdown of desk flows and $$ flows, this week I have included an updated equity demand forecast with some super charts.
Charts of the Week - if you are pressed for time, maybe the best way to capture the mood of the market and the stocks that had the biggest impact of the week.
Portfolio Stocks - this week I bought a new position to take advantage of the AI fueled surge in electricity demand.
Life Hacks - last week we shared our must see events. For me March Madness is at the top of the list.
If this is it for you, thanks for reading. Reach out with any questions or feedback, please.
And please share my blog with anyone in your network that you think would appreciate it. Thanks in advance.
You can follow me on X (@NSLInvestments), or on LinkedIn or simply read my Substack chats. I only post about things that are material to my investment narrative.
Good luck this week!