

FOOL ME ONCE, SHAME ON ME, FOOL ME TWICE......
FOOL ME ONCE, SHAME ON ME, FOOL ME TWICE......

Hello and welcome to another edition of the No Straight Lines Investments blog, I appreciate your time spent reading my blog.
I always enjoy any chance to invoke the words of “W”, and given this week’s hotter CPI and PPI releases, the market is right now deciding whether or not it is being fooled 2x.

As you can see from the chart, the 10-year backed up 23 bps this week to close at 4.31%. The bump up in rates put downward pressure on the indexes overall, and the most rate sensitive, IMV, underperformed it’s bigger cap peers, down 2.1% on the week.
Interest rate futures effectively removed 25bps of easing out of the equation post the release of CPI/PPI, with 1 year ahead FF pricing in 100 bps of cuts. Whether we see a cut in June is now close to a coin toss (55.2%) according to CME Fedwatch, and with FOMC this week, the key question is whether we see one of the baseline cuts removed.
We have a lot of ground to cover, let’s dive in to this week’s key releases.
CPI - SUFFICIENT TO CHANGE THE DOT PLOT?
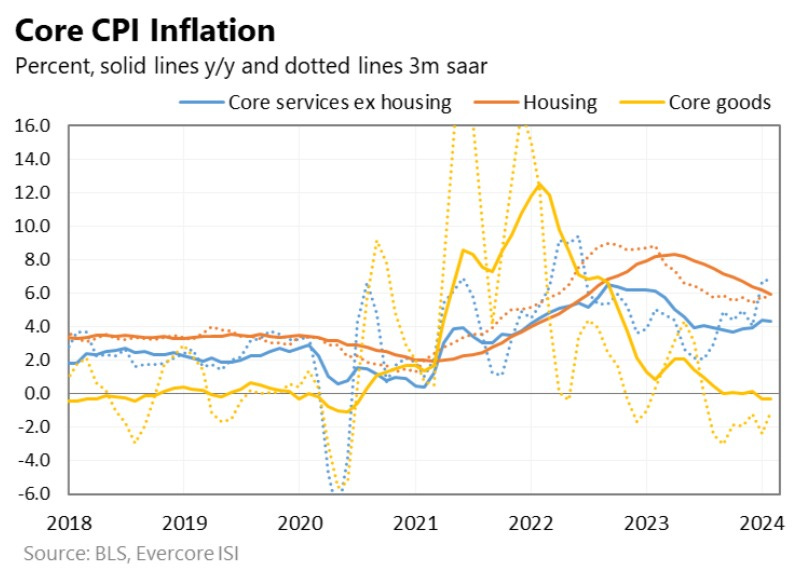
Graph from Krishna Guha, EvercoreISI
Here’s Mr. Guha’s conclusion on the February CPI print:
We anticipate some moderate hardening of the Fed’s tone on inflation and the need to accumulate material additional information to confirm the baseline disinflation story remains on track……we think the report will underscore Fed caution but not fundamentally challenge policymakers view that - subject to validation from March, April and May data - they will be cutting in June with a current expectation of three cuts total this year. Krishna Guha, EvercoreISI March 12, 2024
I had a few key takeaways on the back of the numbers:
Shelter costs remain elevated, but did show decent improvement month/month. Shelter inflation represents 2/3 of core inflation over the past 12 months. OER annualized at 5.97%, which is the 10th consecutive decline. There is still an expectation for these costs to come down in-line with current market measures of rent.
Goods deflation ceased, and was up 1.4% y/y on a 1-month annualized basis. The FOMC had been expecting this, but of course, we need to see the services side soften.
On the services front, CSEH on a 1-month annualized basis was in half at 5.8% against 10.7% in January. Baby steps.
I don’t think this print will alter the dot plots, but you would have to expect Powell and company to strike a slightly more hawkish tone.
The CPI components that translate over to the more closely watched PCE were not nearly as elevated on this print as they were in January. More on this in the PPI analysis below.
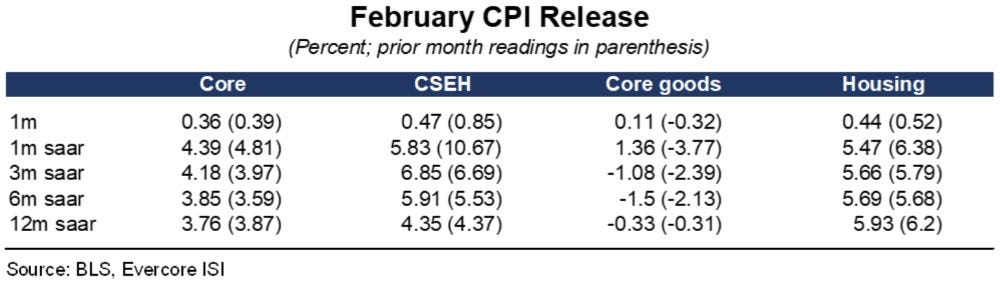
Here is a handy chart of all the critical CPI data:
PPI - LIKELY NOT TOO HOT TO HANDLE

Core PPI was above consensus at 0.3% against 0.2% expected.
As you can see in the above chart from Krishna Guha of EvercoreISI, 3 of the 4 PPI components that carry over into PCE, were less elevated, with airfares surging (much like in the CPI data).
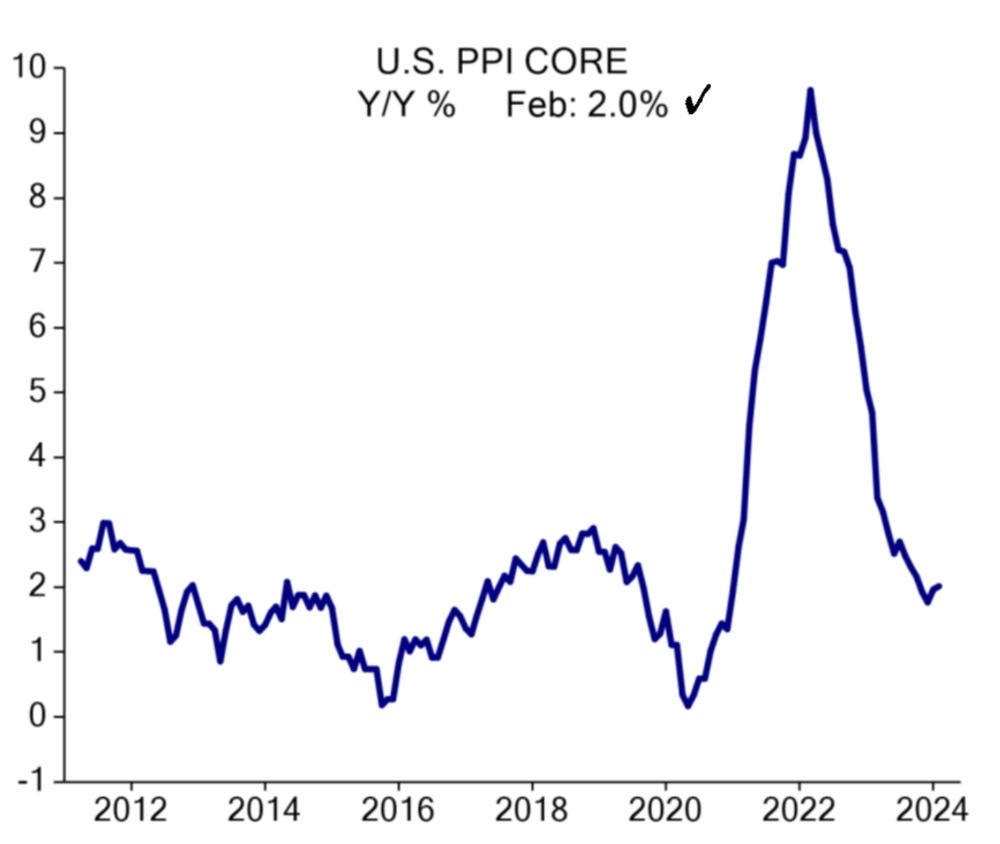
If you look at this graph, PPI isn’t as alarming as some of the headlines might suggest. (graph from Ed Hyman of EvercoreISI).
On the back of the PPI, here is a handy summary of many of the bulge bracket estimates for PCE, from Nick Timiraos of the WSJ:

The conundrum for the FOMC, as Guha suggested, is how to keep their PCE forecasts below 2.6% without removing a cut??
He believes that the Fed may remove a 2025 cut, and leave the 2024 dot plot unchanged at 3 cuts. We will find out this week!
I think it’s important to remember that inflation is one part of the data the Fed is analyzing.
Last week’s payroll showed a clear slowing trend, and overall, the data on consumption (see retail sales below) is also exhibiting a slowdown, full stop.
No Straight Lines!
INITIAL CLAIMS - THE FAVOURABLE TREND PERSISTS
The best real time gauge of the jobs market continues to exhibit strength.

The 4-week moving average of this series has declined for 4 straight weeks, which is not suggestive of any imminent deterioration in the labour market.
The soft landing remains my baseline until I see the jobs picture worsen materially.
RETAIL SALES - WHERE IS THE BOUNCEBACK?
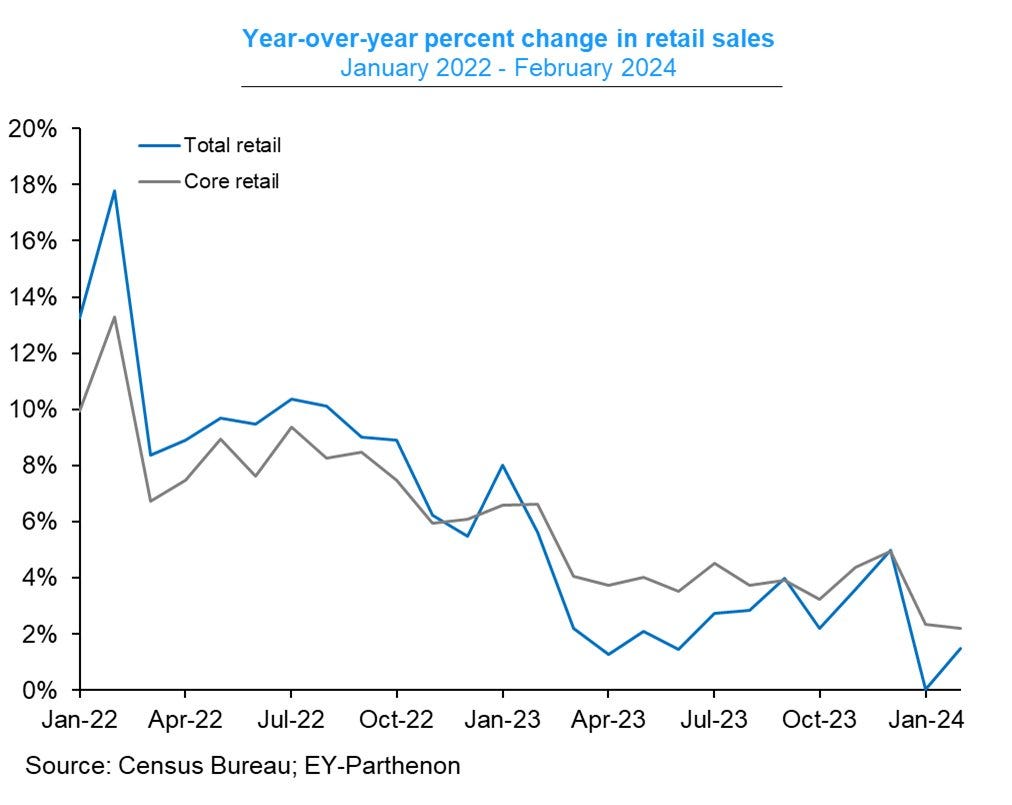
Headline and core retail sales were both below expectations for February, at 0.6% and 0.3% respectively. The inflation-adjusted statistics are not particularly encouraging either.

Both graphs from Gregory Daco
I think these results reflect a more cautious consumer. Based on these data, most economists are downwardly adjusting their consumer spending estimates for Q1 into the 2% range.
Given the outsized influence the consumer has on overall GDP, this trend needs to be watched closely. A slowdown is fine, we just don’t want to see a grinding halt.
Ed Hyman made a worthy counterpoint (as he usually does), that CNW (consumer net worth) is on track to be up 8% y/y in Q1, and tends to lead consumer spending by 6 months.
I would conclude by saying that it rarely pays to bet against the US consumer!
IP/MANUFACTURING - UNREMARKABLE PERFORMANCE FOR FEBRUARY
Ok, so the manufacturing sector in the US isn’t on fire, have a look at the trend since the GFC, the periods above 100 are more the exception than the norm. (Greg Daco graph)
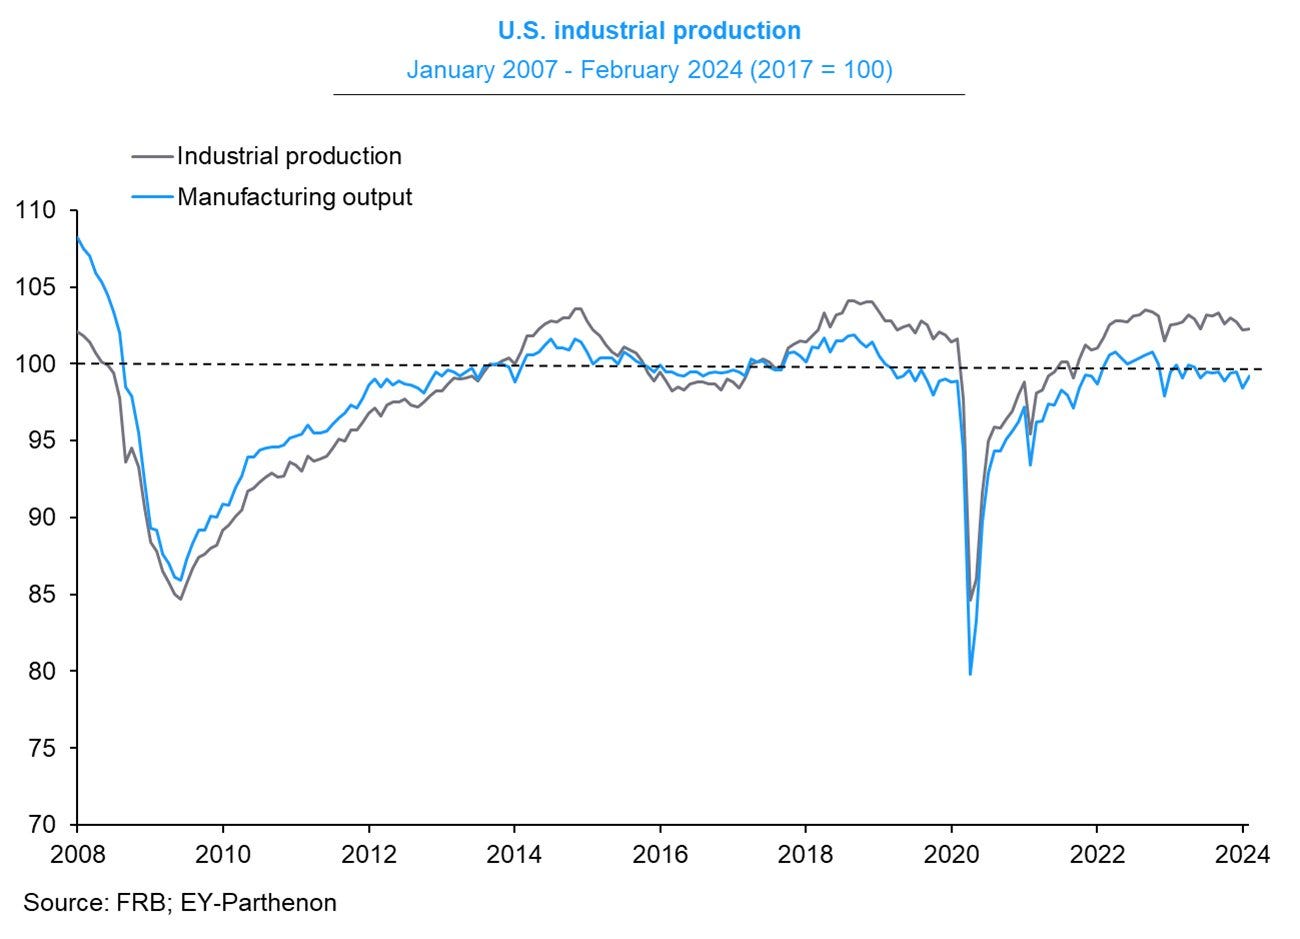
Notwithstanding the slightly disappointing ISM result for February, I do expect a continued modest rebound in manufacturing. I would categorize Feb’s numbers as not dramatic enough to change my thesis.
I am paying close attention to manufacturing as it is a key part of my bull stance on copper and steel. More on copper in a bottom up write up later in the blog.
BOJ - THE END OF NEGATIVE RATES
After a blowout Shunto wage increase of 5.3%, Nikkei has confirmed that the BOJ will increase it’s policy rate to a range of 0% to 0.1% from it’s current -0.1% and also end YCC.
The market was thinking April for the rate hike, but I think the timing isn’t that critical and the BOJ potentially risks credibility points if it doesn’t move now, with the wage data in hand.
The Nikkei 225 is up 15.7% ytd, it will be super interesting to see how equities react to this news, even though it was expected. I would note it was down 2.3% last week, so some of this is likely priced in.
INFLATION EXPECTATIONS HOLDING STEADY

Another handy graph from Ed Hyman of EvercoreISI
The Fed pays attention to surveys such as the NY Fed and UofMich as entrenched inflation expectations can alter consumer spending behaviour. In this case, both the NY Fed and UofMich maintained 3% year ahead views.
On some level the uniformity is comforting, to me anyway.
This is the end of the free portion of the blog. If you want to continue reading (and of course I think you should) you can sign up for the princely sum of $20/month. Here’s what’s on tap this week:
Flow Analysis - money flow moves stocks. Period. Some pretty interesting data to go through this week!
Charts of the Week - if you want to get a pulse on the week in equities, this is a great place to start. You might find your next long (or short) idea.
Portfolio Stock Analysis - this week I cover an AI inspired theme that is getting a lot of airplay, along with a revisit on one of my favourite investment narratives that finally looks set to move in a meaningful way.
Fun tidbits - last week we exchanged recent favourite streaming ideas……mine was The Diplomat on Netflix.
If this is it for you, I thank you for reading. If you want to debate or discuss anything, please reach out.
I make fairly regular posts on X (@NSLInvestments), or LinkedIn and on the Substack chat feature.
Good luck this week!