


GIMME SHELTER (DEFLATION)
STLC/ALS/VRT

Hello and welcome back to No Straight Lines Investments blog, super happy you have decided to join me after another fascinating week in the markets.
For any new subscribers, you can sign up for free using the button below, there is no need to pledge. Thanks for coming onboard!
Before we dive in, I wanted to share your picks for binge worthy shows, in no particular order:
Yellowstone Spin offs (1883/1923) - I loves Yellowstone, so stoked to check ‘em out!
Shrinking - several folks have suggested this, looks fabulous
Marvelous Mrs Maisel - have watched previews and have been intrigued
East Bound and Down - big fan of Danny McBride, so I’m sure it’s great
Jack Ryan - loved the old movies, been told series is great
Reacher - just finished watching, fantastic and fast moving, 2nd season coming December
The Night Watch - my wife and I are in the midst of this, it is well paced with some great twists!
Keep the suggestions coming, can never have enough great shows in the queue!
CPI - SHELTER STILL THE BOSS
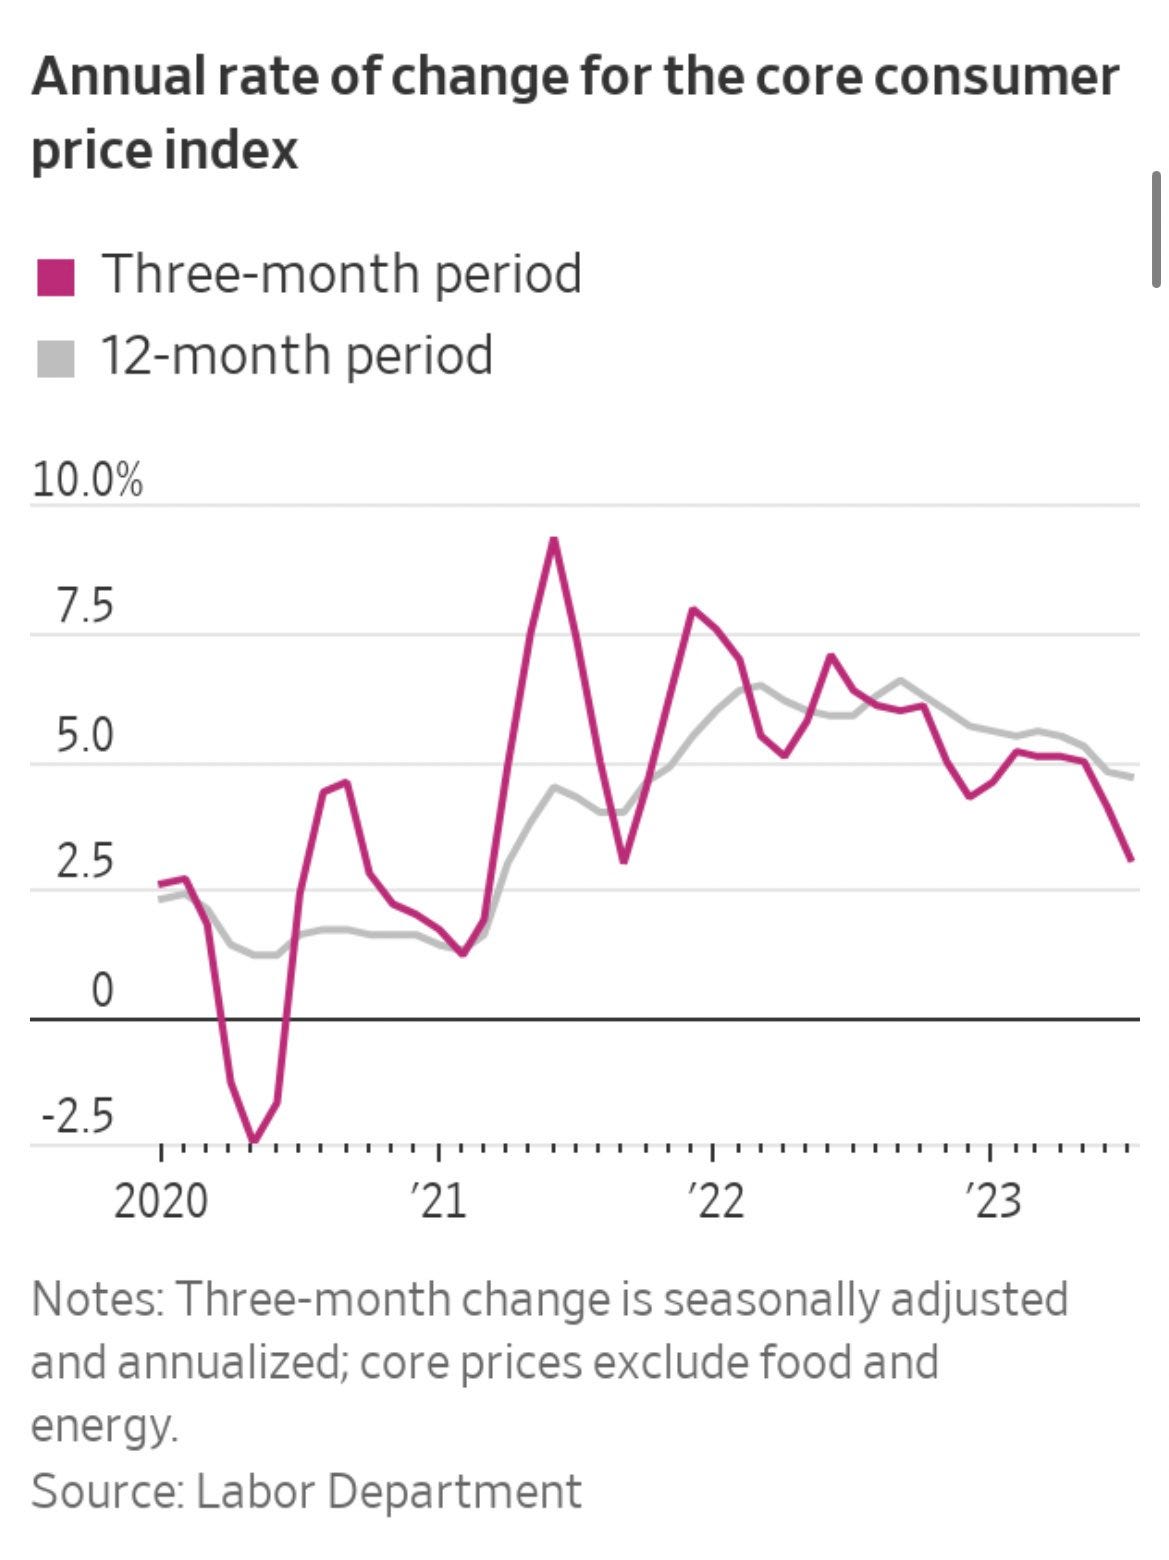
The 3 month annualized rate of core CPI is now back to 2021 levels.
Shelter was responsible for 90% of the CPI gain for July (hence my choice of title). I have a bunch of data points on shelter that point to a significant easing in shelter inflation going forward.
For example, the SF Fed released a paper earlier this week which suggests that shelter inflation may turn negative by mid 2024:
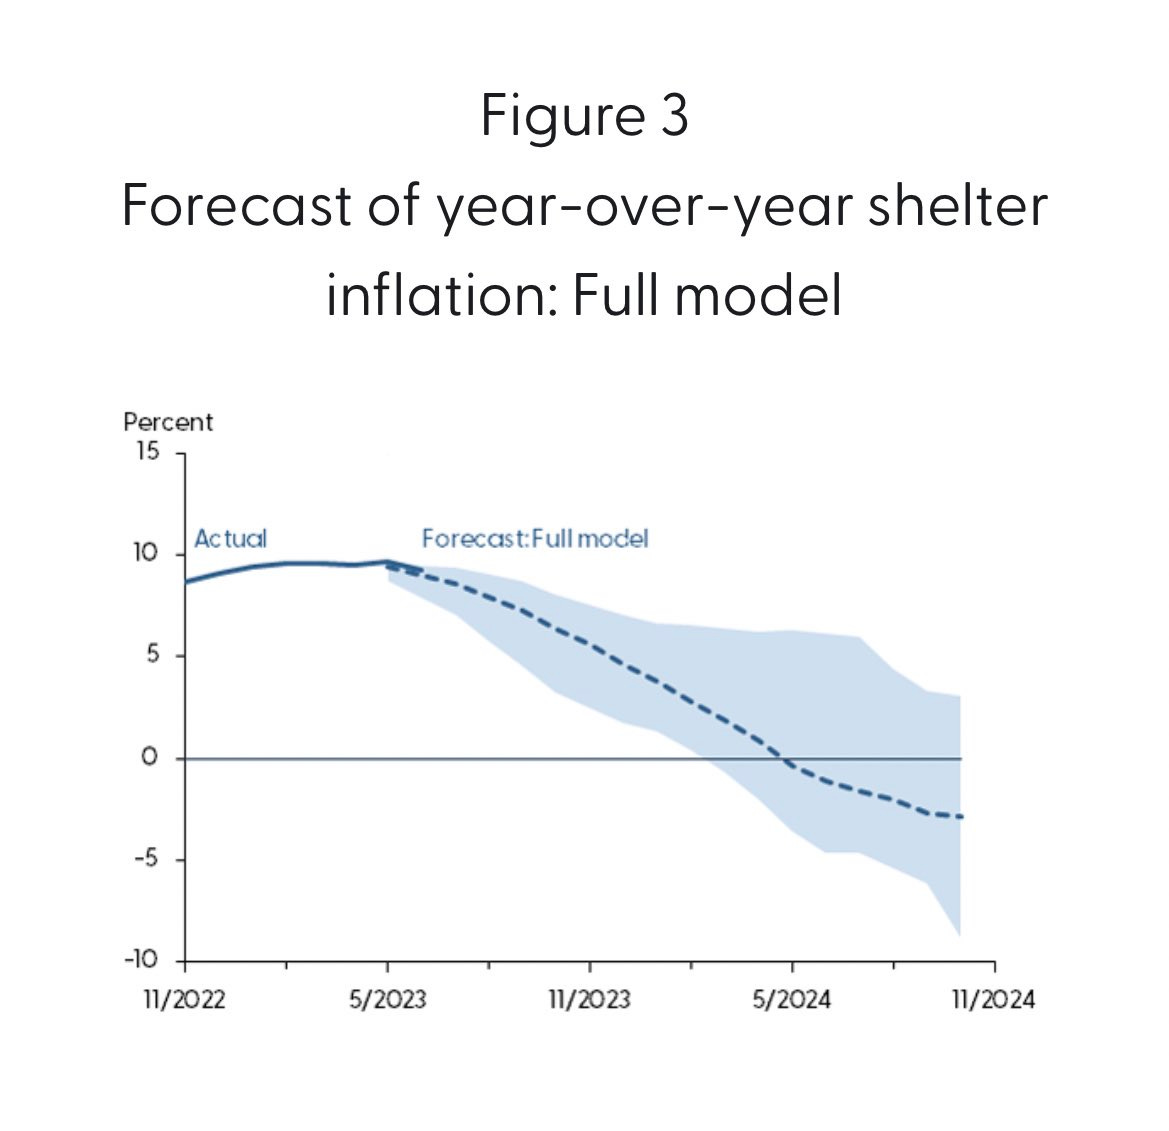
This is not some random blogger, this is the SF Fed. Notwithstanding how poorly the Fed has forecast pretty much everything, this is notable.
Bespoke also did a series that suggests rent deflation is around the corner:

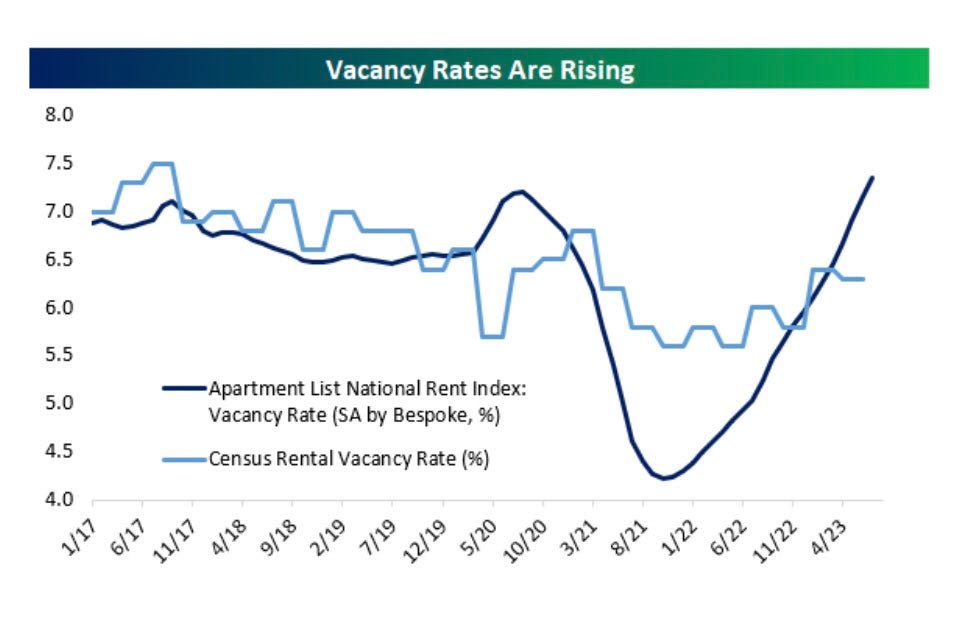
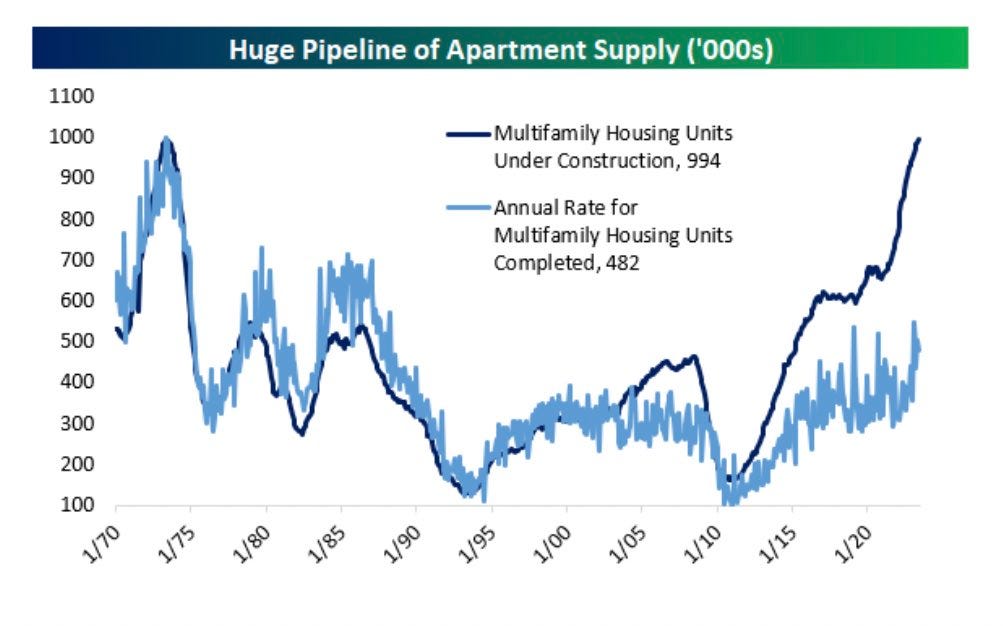
The writing is on the wall of rental units all over the US!
What is so interesting to me is that there is a bunch of work being done on how other aspects of CPI may start to turn up e.g. gasoline.
It is precisely that kind of environment, looking for the next shoe to drop instead of focusing on where the improvements are happening.
Just as an example, EvercoreISI commented on Thursday about the potential for the commodity move higher to potentially seep into core goods inflation, which would bleed into services??
There is already discussion around the idea that headline CPI (not core) is looking hot for August.
The current probability of a hike at the September FOMC is 10%, so the market ain’t buying the idea of a hot headline CPI, at least not yet.
Final point, which is courtesy of RBC Economics, is that Core Services ex-shelter (‘super core’, preferred gauge of the Fed) 3 month annualized rate is 1.7%, below the 2.5% average pre-pandemic years of 2018/2019. I haven’t seen any other analysts publish that comparative, so I figured I would share.
Bottom line, this CPI keeps the soft landing narrative afloat. Both Goldman Sachs and Fundstrat made the call that this CPI has signalled the end of rate hikes by the Fed.
INITIAL CLAIMS
As you folks know, I publish my views on this data series every single week because it is the best real time gauge of the job market between non-farm reports. I found this chart from Nick Reece helpful, he uses 9-week moving averages for Initial and Continuing Claims, and usually heading into a recession, at least one of these is trending positively:
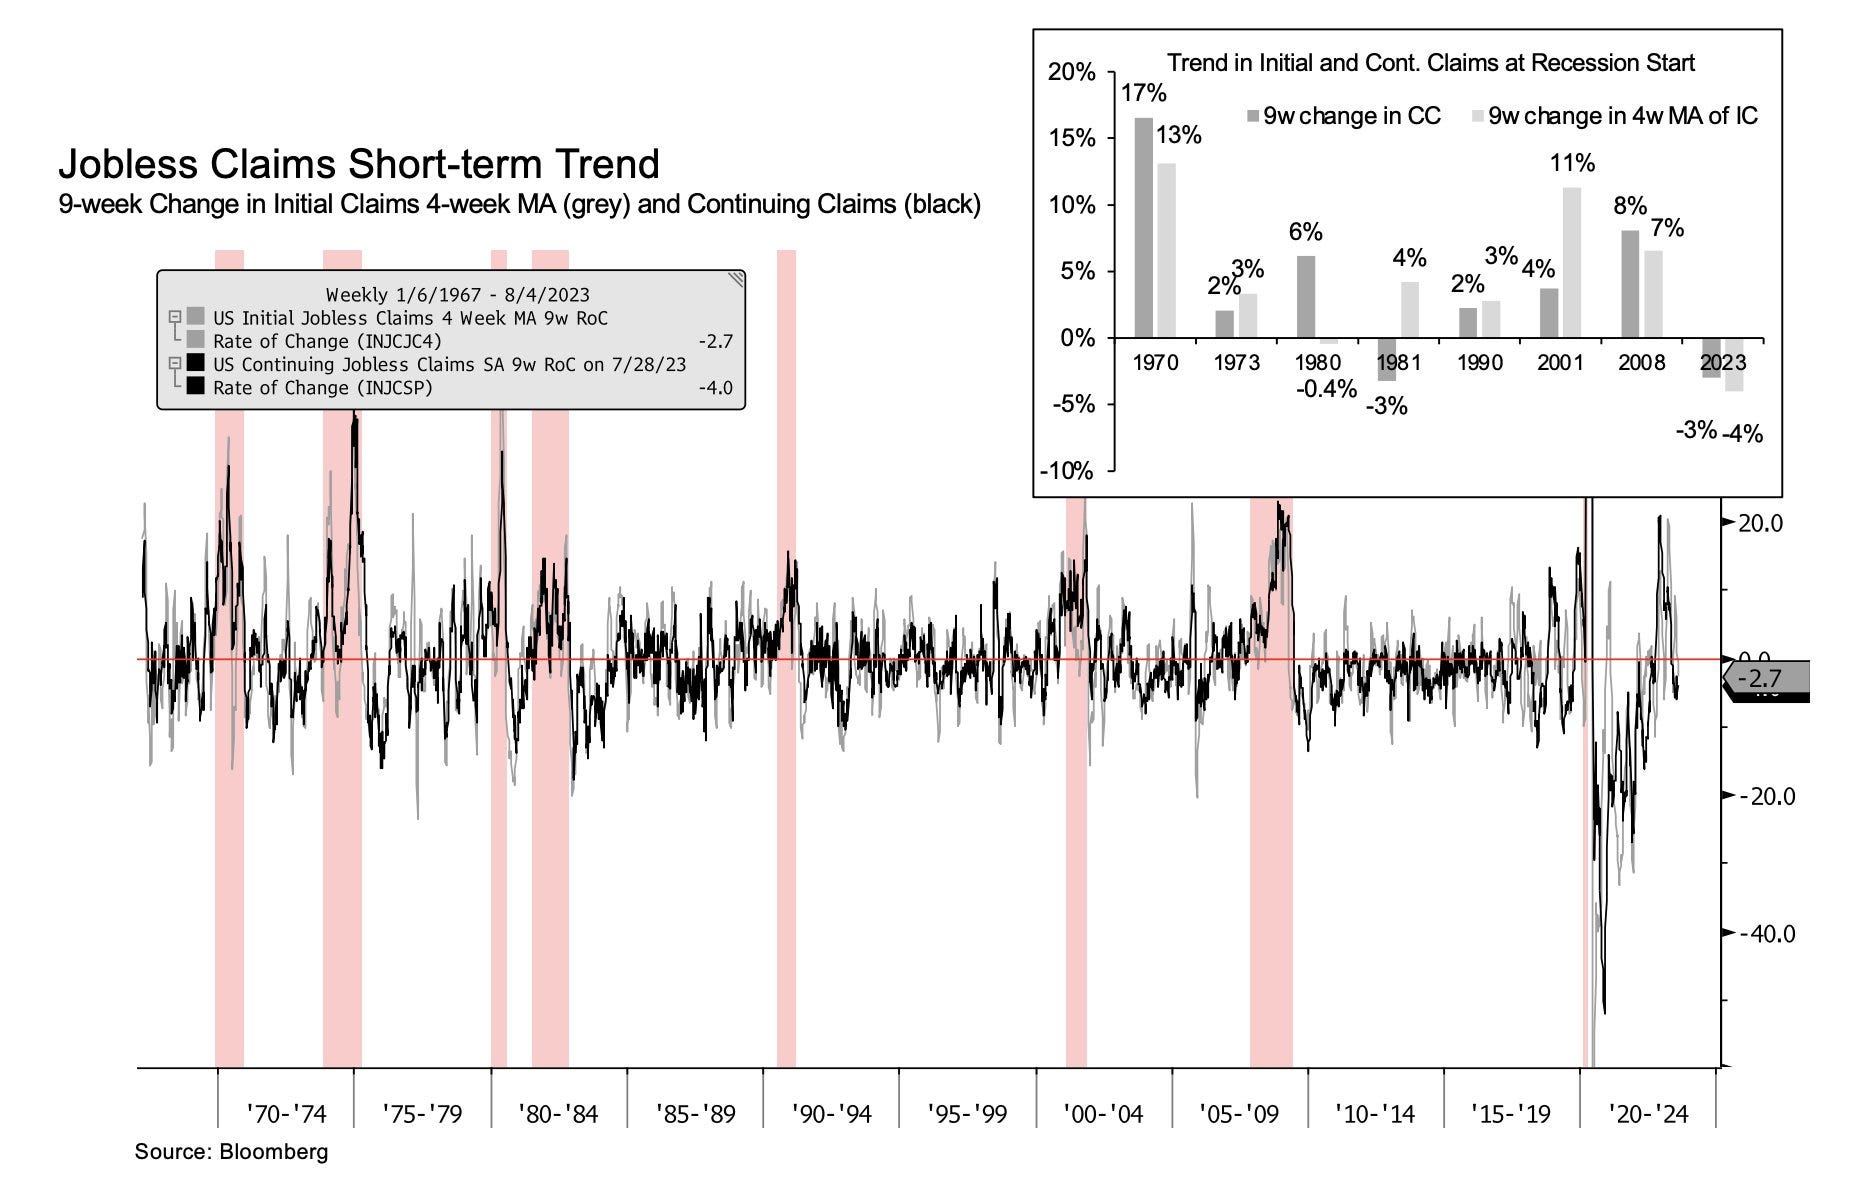
So the signal is not happening, at least not yet. Initial claims were definitely hotter this week at 248k versus 230k expected. I will continue to follow closely.
NFIB - SUDDENLY NO ONE CARES?
In the aftermath of the regional banking crisis, much ink was spilled about the coming apocalypse for small businesses.
Small business is worthy of focus, as it drives 2/3 of job creation in the US.
The NFIB Optimism index came in slightly better than expected for July at 91.9, also an improvement over previous month reading of 91.
More importantly, check out this graph from Liz Ann Sonders:
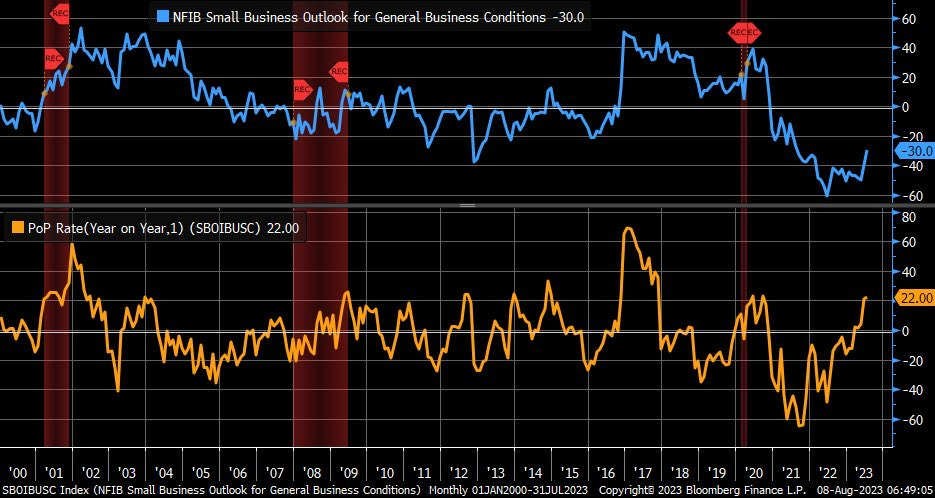
So the outlook is still -30, I’m not dancing in the streets just yet.
However
The year on year improvement was the fastest since September 2020.
When data is in the toilet, we look for signs of bottoming or improvement. This strikes me as the latter.
We will be watching the outlook reading closely next month, but this is a good start.
CHINESE IMPORT/EXPORT DATA STILL WEAK
No need to sugarcoat it, Chinese imports at -12.4% y/y and exports at -14.5% y/y were abysmal. For the 7 months YTD, imports were down 7.6% and exports were down 5%.
Still waiting for the vaunted bounce back in the Chinese economy. Will have a bit more to say about this below with regards to metals demand.
It is quite interesting that the commodity cluster has caught a bid in the midst of no apparent recovery in the world’s second largest economy.
The import data implies that the domestic economy is failing to take flight. Various stimulus measures so far have not had any measurable impact, we’ll be watching closely, as always.
PPI - MONEY MANAGER INFLATION
PPI headline and core were both slightly hotter than expected, have a look at the monthly trend, with thanks to Liz Ann Sonders:
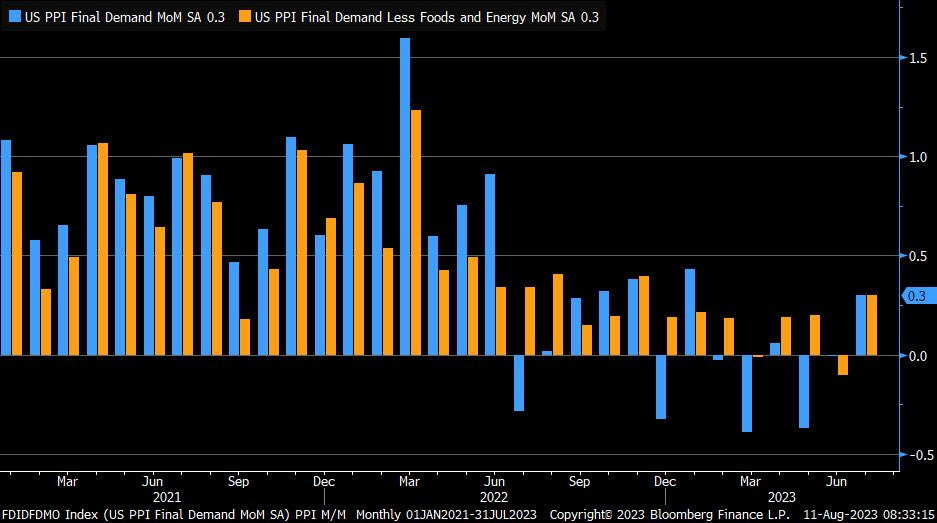
The data caused a sell off in bonds.
Digging a bit more beneath the surface, turns out that 40% of the increase is due to portfolio management fees. Further, if you take a look at this correlation published by Steve Liesman, you can see fees move almost perfectly with the S&P 500:
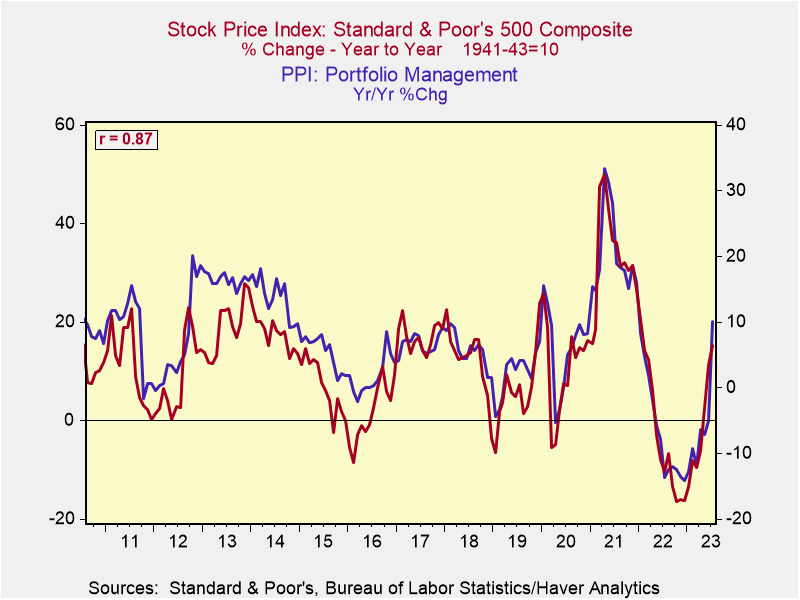
Is this actually inflation? I would suggest debatable.
Whatever your interpretation, it’s clear the bond market did NOT like the print!
Q2 EARNINGS - NO HUGE SURPRISES
As of Thursday, 457 of the S&P 500 co’s had reported, with earnings clocking in at -6.4% y/y. Expectations were -9% heading into reporting, so positive revisions have taken these collective numbers higher.
EvercoreISI suggests that current trends point to overall S&P 500 earnings declining 4.8%. Here is the EvercoreISI scorecard:

I am going to declare Q2 earnings overall better than feared. The conference calls that I tuned into were not downbeat. I would suggest that management teams struck the appropriate balance between optimism about their specific business whilst recognizing the uncertain business climate.
It is clear you need to pick your spots and do your work. Plain old stockpicking!
FLOWS
Have a look at the 4-week sum of flows in the chart below, from Isabella Rosenberg of Goldman Sachs:

What stands out to you?
To me it’s the almost $90B into money markets, and the fact that bond inflows are still larger than equity inflows. Does this strike you as over the top bullish??
I know I sound like a broken record, but the fact is talk is cheap. Sure survey data is way more bullish than it was to begin the year, the reality is that feeling better isn’t translating into $$ flowing into the equity market. Period.
Much attention is paid to the CTA community, and at any point these folks represent 20% of volumes, so of course it matters.
I also know that demand/supply predictions from this crowd change in an instant, so if it looks skewed to heavy supply (as it does currently according to Scott Rubner of Goldman Sachs), I take it as part of the mosaic.
In terms of noteworthy sector flows, here is my take:
China Flows - $5.8B inflows into mainland China funds, adding to the 4-week total of $15.6B. You will note that TOTAL equity inflows over 4 weeks were $17.9B…..just saying. Definitely contrarian flow data here.
Energy Flows - $1.2B of inflows, 4-week total of $1.5B. Quoting from memory, but I believe there were 14 straight weeks of outflows. Energy equities look very good right now.
Industrials Flows - smallish inflow of $320mm this week, but 4-week total of $2.2B. Certainly a cyclical bent here, considering energy flows above.
Technology Flows - $1.8B of inflows, and a 4-week total of $4.9B. This is interesting to me because overall tech stock performance has been lacklustre.
Financials/Materials/Commodities Flows - interestingly, to me anyway, overall 4-week flows to this group was a whopping $147mm. I would have expected more robust $$ simply because it would be consistent with a pro-cyclical narrative (financials/materials/energy/industrials). So much for that theory?!
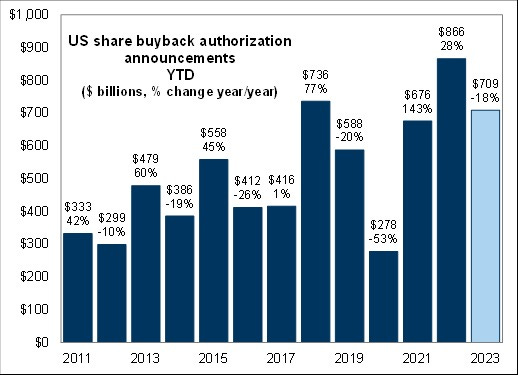
Another key factor to consider is that 91% of corporates are now active on buybacks. The across the street daily demand for buybacks is $5B, according to Goldman:
CONCLUSION
The past few weeks the focus has principally been on earnings results. On that front, I would suggest Q2 has passed the test and outlooks are certainly not suggestive of a pending disaster.
Investor positioning remains tactically neutral, in my opinion. Flow data suggests to me that investors are overall cautious, but willing to focus $$ on perceived winning sectors, not just technology, but also energy and industrials. This is evidence of stock picking, albeit “sector” picking if I’m being truthful about it.
The fact that odds of a September rate hike ended the week at 10% suggests to me that CPI and PPI data, while overall mixed, didn’t change anyone’s mind about inflation continuing to fall.
Claims data was up but as I hopefully proved above, we are still not in danger territory.
The overall indexes are trading at healthy multiples, and the market has absorbed the double blow of the Fitch US ratings downgrade along with a heavy supply of treasury issues. It is understandable that equities are taking a bit of a pause.
I am using this as an opportunity to continue to dig into stories that I believe warrant investment.
On to stocks and charts that I find interesting.
CHARTS OF THE WEEK
As is always the case, all charts are the handiwork of the Bay Street Doctor, so thank you as always my friend.
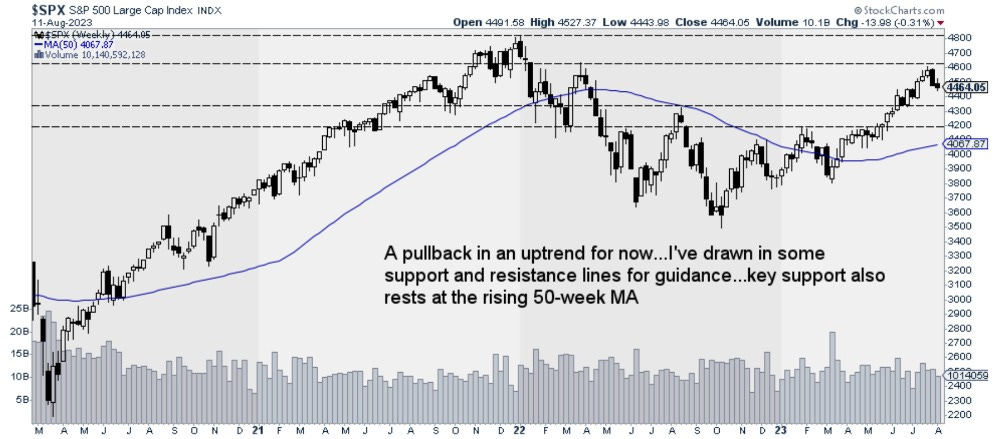
Sometimes you just need to step back to achieve better perspective. Look at all of the work that has been done since the mid-March regional banking crisis. This is still a very healthy looking chart and some consolidation is to be expected.
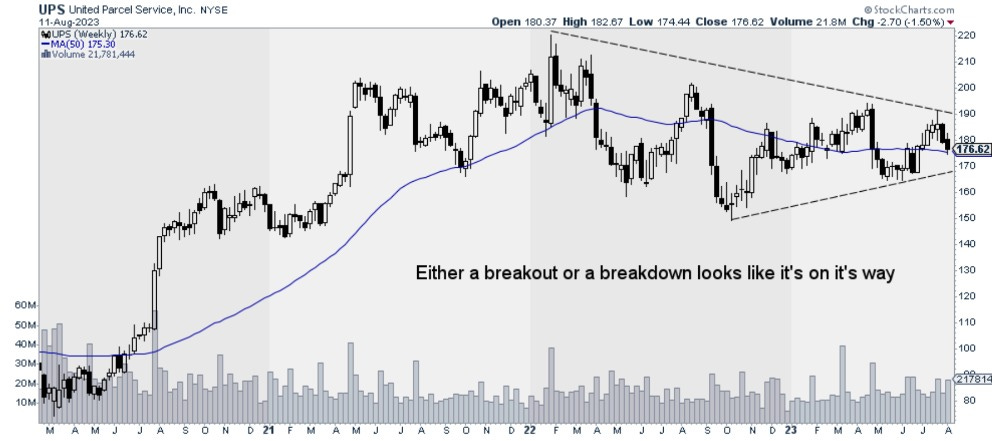
Obviously a global economic bellwether. Q2 results were ok, with earnings ahead and revenues light. I pay attention to volumes as more of an economy-wide read, and domestic volumes were down 9.9% with international down 6%. I would caution that domestic was impacted by threatened strike action, so it’s not a direct read. Revenue guidance for full year 2023 was decreased by 4.1%. This isn’t great but not neither is it awful.

The parent of Tim Horton’s/Burger King/Popeye’s posted excellent Q2 results. So why the rollover? Just have a look at the almost parabolic move since March and you can probably explain the bulk of the soft reaction to great numbers. Most analysts nudged their targets by $1 or $2. The restaurant group has been magnificent and the fundamental drivers remain solid, it’s just stretched valuation that is keeping a lid on performance for now. Shame on me for not being involved.
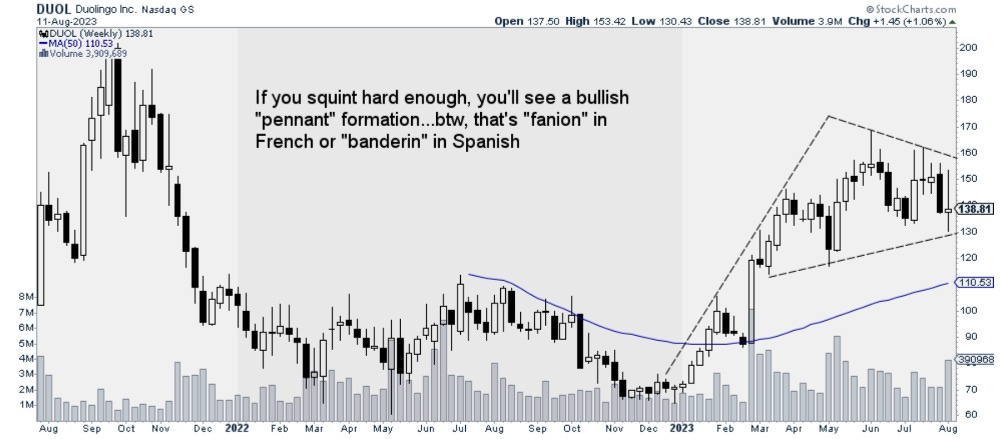
Both my wife and kids use this app, it is an outstanding tool for learning another language. I am going to dabble in French (so I can help my kids with school) and Italian because I want to keep the dream alive of living there one day. DUOL posted stellar Q2 results and even better full year guidance. Commentary from desks suggests the stock was underowned going into the print, so I would suggest it is a name worthy of more work. I will be back to you folks.

Investors were worried about the Security results after poor numbers from peer FTNT. AKAM delivered 14% growth in security and called out continued strength for the year (13% full year growth). One of the 800 lb gorillas in the space, PANW is reporting this Friday, so stay tuned!!

DDOG had a nice run until this week’s Q2 results disappointed the big data/AI crowd. Much of the weakness is being pinned on DDOG’s dependence on smaller customers. What is a bit interesting to me is that the revenue guide decreased but the operating income guide for the year actually went up?! Let’s see what SNOW mgmt have to say when they report.

Much like it’s US peers, Air Canada reported fantastic Q2 results and increased guidance for the full year. Unlike it’s US peers, AC will not be contending with as much domestic pricing pressure due to it’s comfortable duopoly with Westjet in Canada (apologies to the smaller players but competing on price without scale is simply not a business model anybody is going to finance). I continue to like the travel theme. Worth mentioning that UK company TUI suggested that winter bookings are looking solid at this point.
These next two charts were selected by the Doctor. The usual process is that I pick names and he provides the picture. These are two of the best graphs I have seen in some time:
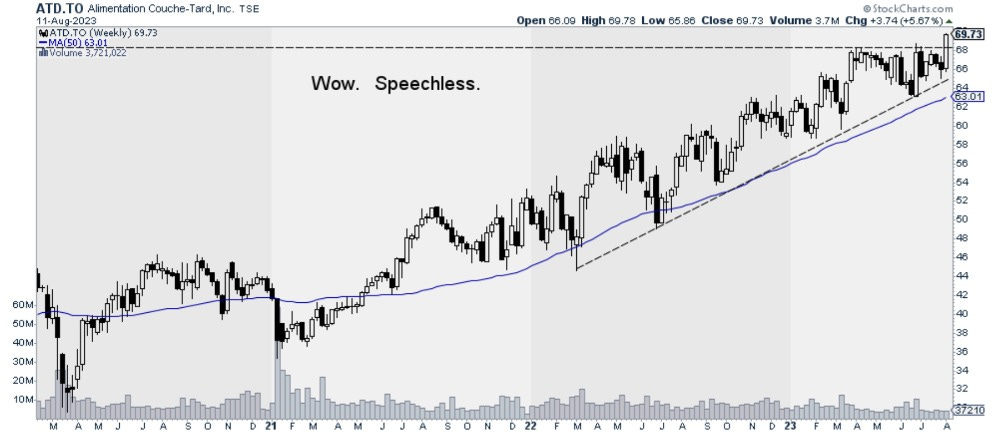
I have never owned Couche-Tard, and that has been a bad decision, period.
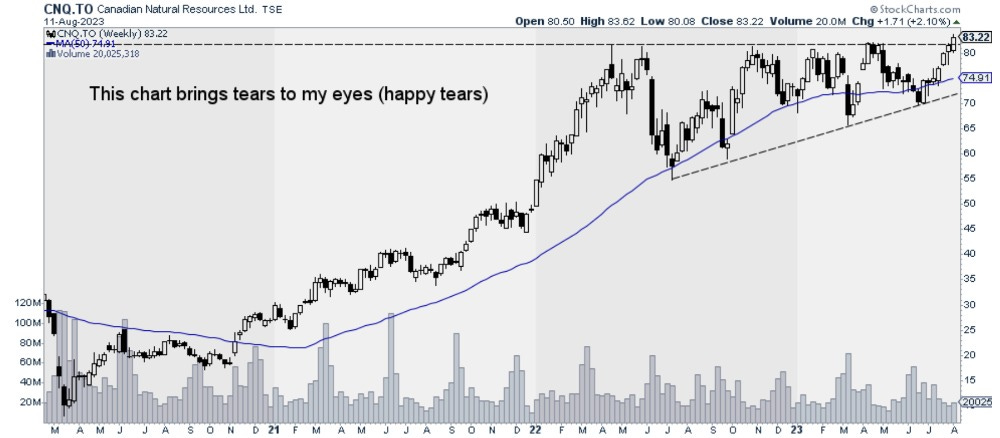
I do own the CNQ and am obviously pleased with this representation!
STLC - NOT THE QUARTER I WAS EXPECTING

There were 2 principal things I got wrong about STLC’s Q2:
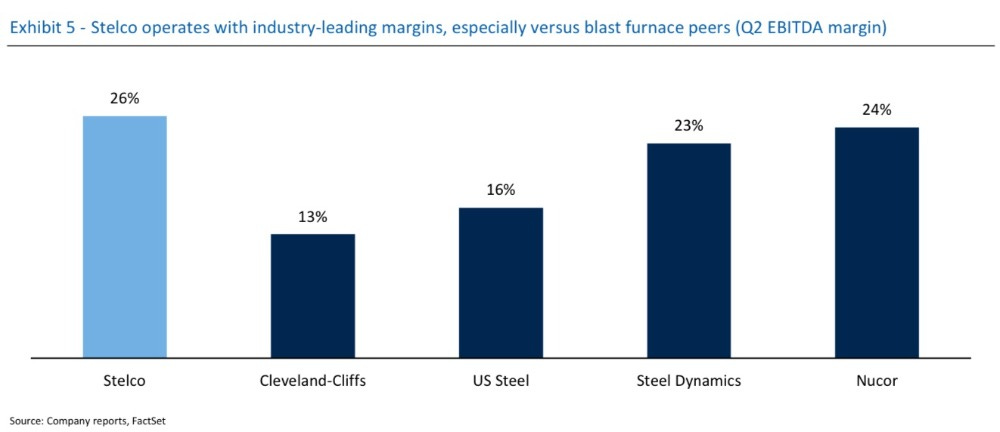
Costs were much worse than I expected, with coal pricing peaking (according to the CFO) in the quarter. Shipments of galvanized product were also higher, and zinc costs were higher, resulting in lower margins. Having said that, have a look at STLC’s EBITDA margins relative to peers for Q2 (RBC):

Shipments were lower, as some customers deferred delivery of product until July. This had an impact on lower sales/shipments for Q2 but also resulted in much higher inventory levels exiting the quarter, which negatively effected free cash. Customers are cautious due to the potential of a pending strike from auto workers. I didn’t anticipate the level of restraint exhibited by auto OEM’s.
What hasn’t changed about STLC is :
Huge Cash Position - STLC has $784mm in cash, or approximately 35% of it’s market cap. Alan Kestenbaum is on the record (and reiterated on most recent conference call) that a cash balance of $300mm is more than adequate. At some point a special dividend is inevitable in my view.
Most Profitable Steel Company - as shown above, STLC has the highest EBITDA margins amongst it’s peers. Even with depressed steel prices in the 2H of the year, STLC will still generate FCF of $50mm. I’m not convinced steel prices are going in the tank if the economy doesn’t fall into recession. The point is that heroic assumptions are not required to generate positive free cash.
Stock is Dirt Cheap - with the news that US Steel is exploring strategic alternatives and subsequent news the CLF’s has made an offer to acquire X for $32.50/share, it is even more relevant to examine STLC’s discounted valuation. The offer implies around 6.0x 2024EV/EBITDA for X. There is a fairly wide range of estimates for STLC’s ‘24 EBITDA (implying 3.6x to 2.3x), but no matter which way you slice it, the offer for X looks like a minimum 50% boost to STLC’s current valuation. I think more critically, it should be positive for steel prices as the combined CLF/X would garner roughly 30% market share (per CLF’s disclosures). More control in fewer hands is generally better for pricing. It could also shake loose some investment opportunities for STLC, but only if it meets their strict hurdle rates.
It is a Cyclical Investment - as you may have noticed above, $$ have been flowing into Industrials/Energy. STLC definitely fits this theme. We now have M&A to add to the situation, even if you don’t think STLC is actually in play. At the very least, there will be more investors looking at STLC as an investment as a result of the X/CLF potential transaction.
For now I am sticking with my STLC position. To me the downside seems to be priced in with no regard for potential capital returns such as a special dividend. The added dynamic of M&A in the steel sector should provide baseline valuation support for the stock in the interim.
VRT - STICK WITH THE COOL (ING) STOCK
EvercoreISI hosted an AI conference last week, and there were some crucially important takeaways. I am just going to list the key conclusions from a Data Centre Infrastructure expert, as laid out by Amit Daryanani, the analyst who covers VRT for EvercoreISI:
Strong Demand/Tight Supply - AI is creating a step function upward in data centre demand, whilst supply remains tight, and availability is a key customer concern. The expert called out Power Infrastructure as acutely constrained, in particular with UPS, PDU’s, switchgear and other power electronics.
Vendors Have Pricing Power - Given tight supply, vendors continue to enjoy pricing power over customers. Pricing and supply are expected to remain tight in the medium term.
Service Capability Advantage - Service capability remains a key competitive advantage in enterprise + edge deployments as these customers typically do not have in-house teams.
The combination of these factors sets up VRT extremely well. The data centre power and thermal management industry is poised for strong growth over the next several years.
The most compelling aspect of VRT, to me, is that the stock trades at 17x ‘24 eps, with strong visibility on growth for the next several years, and a margin improvement backstop in the event that growth is less robust. A truly fantastic combination.
I am maintaining my position in VRT and will look to add opportunistically.
ALS - PIECES ARE IN PLACE, NEAR TERM CHALLENGED
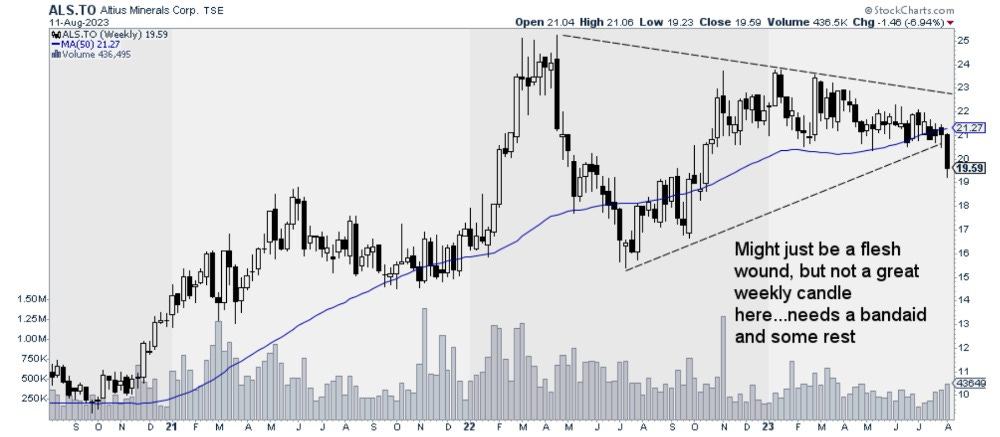
ALS reported slightly worse than expected Q2 results. Results were dragged to a large degree by softness in potash pricing. We can debate the extent to which pricing can move lower, but over the next few quarters, it will be a challenge for the company to offset the lower potash royalty revenues.
If you look back on my initial comments on ALS, there were some key catalysts that I was looking for:
Silicon Project Update - Anglogold Ashanti has provided an update on the Expanded Silicon Project, which outlines a 10mm - 12mm oz oxide target. ALS holds a 1.5% NSR royalty along with a 20% equity interest in Orogen (which also has a 1% NSR). Brian Dalton has made no secret of the fact that he would love to swap this royalty into a metals streaming royalty (likely copper). With the updated resource estimate, I still firmly believe there is a big value enhancing transaction in the pipeline. This could represent $200m + of value, and most analysts are carrying minimal value in their models.
KAMI - we are still awaiting an updated feasibility study on the KAMI project. Importantly, this updated study will assess whether the project is suitable for DR (direct reduction) iron ore pellet feed. This is the fuel for EAF steel production, which is where the steel industry is heading in an effort to curb GhG emissions.
ALS holds a 3% gross sales royalty on the KAMI project.
Just to remind you folks of the importance of KAMI to the future of ALS, this asset could represent close to $40mm of royalty revenue whilst operating at 1/2 of planned capacity. We are likely 2 to 3 years from the project being sanctioned, but this is coming down the pipe.
ARR - the opportunity for ARR to play a key role as part of the capital stack for wind and solar projects has only grown in size. In the very near term, there is a significant interconnection backlog which has caused a slowdown in deal cadence. This doesn’t change the dynamic whatsoever, it is just a timing issue.
In short, ALS is bursting with optionality. In hindsight, I was overly optimistic on the timing of these catalysts playing out, in particular, I expected ARR deal pace to be more brisk and I also believed that the updated resource at Silicon would be disclosed sooner. I imagine discussions have been ongoing around Silicon, but until there is a vetted number (such as we have now), it would be difficult to complete a transaction.
I remain a comfortable holder of ALS. I have reduced my holdings over the course of the past 6 months principally as I had what I believed were better near term uses of my capital. I will happily redeploy into ALS as some of these catalysts I have highlighted above start to reveal themselves. It is a superb company with one of the best CEO’s I have come across in my nearly 30 years in the investment world.
FUN STUFF
Historically I have not made a practice of reading books more than 1x.
This summer as my wife and I have been sorting through boxes of books at the cottage, I have actually reread a couple of selections.
For this week, I would like to know a book that you have read more than once and why?
I am currently reading Liar’s Poker for the 2nd time and I have to say I am enjoying it even more the second time around. Anyone who enjoys investing should give this book a read (or two)!
As always, I would love to hear any feedback and debate any of the points I have made this week.
If you enjoy this write up, please share with anyone you believe you also enjoy it. I thank you for the references, it's without question my best source of new subscribers!
I wish you the best of luck this week, stay focused on the facts and ignore the noise, the market is dynamic and narratives change rapidly.
Until next time.
J