

IS THE MARKET EXTRAPOLATING JANUARY INFLATION TOO FAR?
IS THE MARKET EXTRAPOLATING JANUARY INFLATION TOO FAR?

Hello and welcome to this week’s edition of the No Straight Lines Investments blog, whether it’s your first time reading or you are a regular, I very much appreciate you joining me for another fascinating week in the markets.
Have a look at the following chart from Goldman’s Kamakshya Trivedi/Dominic Wilson:

We have swung from pricing in excessive rate cuts to now seemingly not pricing in quite enough, at least in the views of GS (and many other Wall Street firms).
The disinflation part of the soft landing narrative has been paused and now becomes the key unknown heading into the February inflation data. Was January a blip or is there an inflationary surge coming?
The question cannot be answered without the data, so we will see what the numbers suggest. I feel like the big drivers of the hot CPI/PPI (shelter the big one) are bound to decline, but that view and a nickel still only gets you a nickel!
What is most interesting to me is that the equity market has continued to do well (S&P up 16 of past 18 weeks), even as the market has rather dramatically adjusted the number of cuts expected this year.
Here is a great quote from Trivedi/Wilson that summarizes the above:
What matters more for equities, in our view, is a Fed that is willing and able to ease policy in the face of slower growth instead of the exact number of cuts needed to deliver that. Trivedi/Wilson Goldman Sachs, February 26, 2024
Time to analyze this weeks data.
PCE - NO NEGATIVE SURPRISE

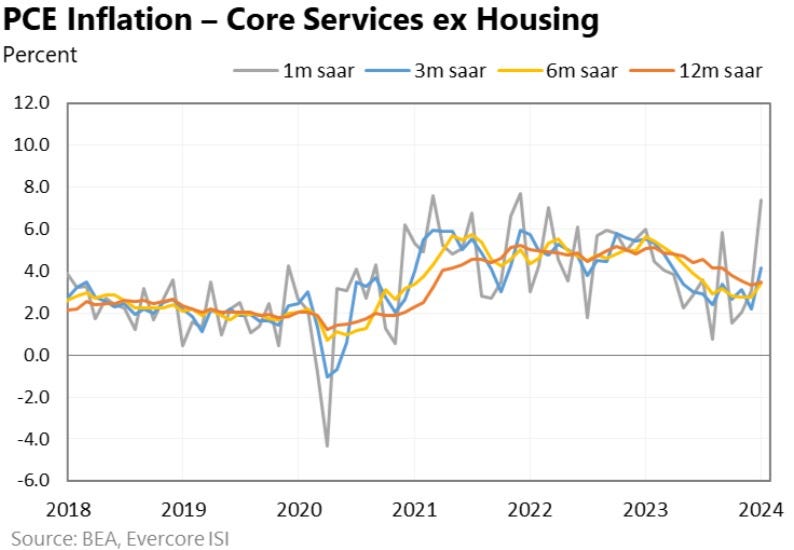
Graphs from Krishna Guha of EvercoreISI
I will begin with the conclusion (my apologies for the improper structure, I haven’t taken any proper writing courses):
We think January will turn out to be more of a bump in the road than a new trend, and this is the working hypothesis for most Fed officials, though this needs to be validated. Krishna Guha, EvercoreISI, February 29, 2024
Core PCE inflation clocked in at 0.4%, bang in-line with consensus, and managing to eke out a y/y decline to 2.8% from December’s 2.9% reading.
The jump in 6 month annualized to 2.5% from 1.9%, being Powell’s preferred gauge, will certainly garner attention.
Rather than blathering on about more details, I thought I would share a table created by Mr. Guha, where he “normalizes” OER and goods inflation (5-year pre-pandemic average):
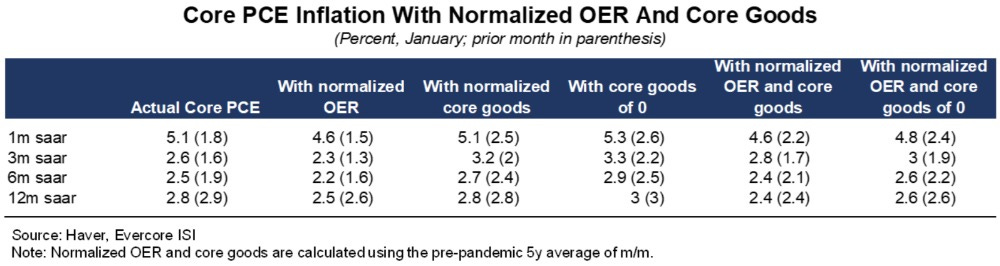
If you look at these adjusted numbers, assuming you believe that goods inflation will revert to normal (something Powell has outright suggested) and that shelter inflation will decline, you can see that outside of the 1 month annualized readings, we are within striking distance of 2%.
As Mr. Guha pointed out, this still requires validation by the actual data.
CME Fedwatch odds for a June cut at 52.8% are only up modestly from a week ago at 52.3%.
The 10-year treasury closed the week at 4.18%, down 8 bps on the week.
US MANUFACTURING ISM - HEADLINE WEAKNESS BELIES UNDERLYING STRENGTH

So the headline ISM was disappointing (to me) at 47.8 against consensus expectations of 49.1, and not really corroborating the strength in the S&P Flash reading.
Can you sense a “however” coming?
Simply read the quote from Tim Fiore of ISM:
Demand is at the early stages of recovery, and production execution is relatively stable compared to January, as panelists’ companies begin to prepare for expansion. Suppliers continue to have capacity but are showing signs of struggling, due in part to their raw material supply chains. Forty percent of manufacturing gross domestic product (GDP) contracted in February, down from 62 percent in January. More importantly, the share of sector GDP registering a composite PMI® calculation at or below 45 percent — a good barometer of overall manufacturing weakness — was 1 percent in February, compared to 27 percent in January and 48 percent in December. Among the top six industries by contribution to manufacturing GDP in February, none had a PMI® at or below 45 percent, compared to two in the previous month. Tim Fiore, ISM, March 1, 2024
Only 1% of the overall sector is below 45, and you can see the sequential improvement since December.
I would suggest the overall number isn’t telling the full story here.
To better understand why I am spending so much time on the manufacturing recovery theme, have a look at this nifty chart included in the Trivedi/Wilson piece from Goldman Sachs I referenced above:
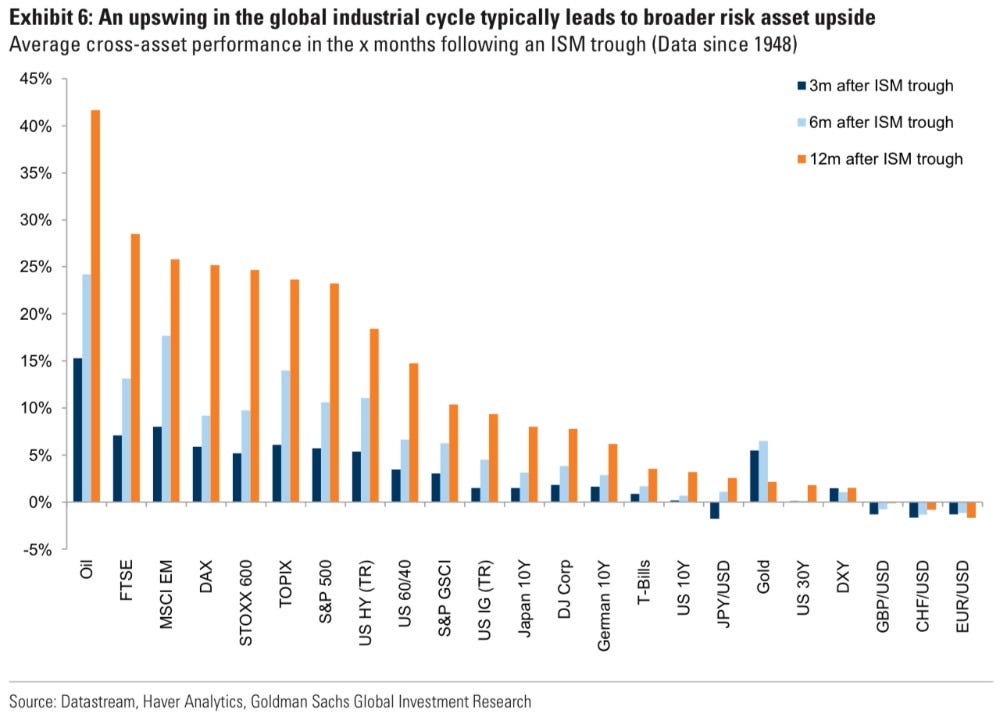
What’s not included in this list is the TSX, the Canadian market is too small to rate. But with it’s heavy weighting in energy/materials/industrials, it would have to rank highly on this list.
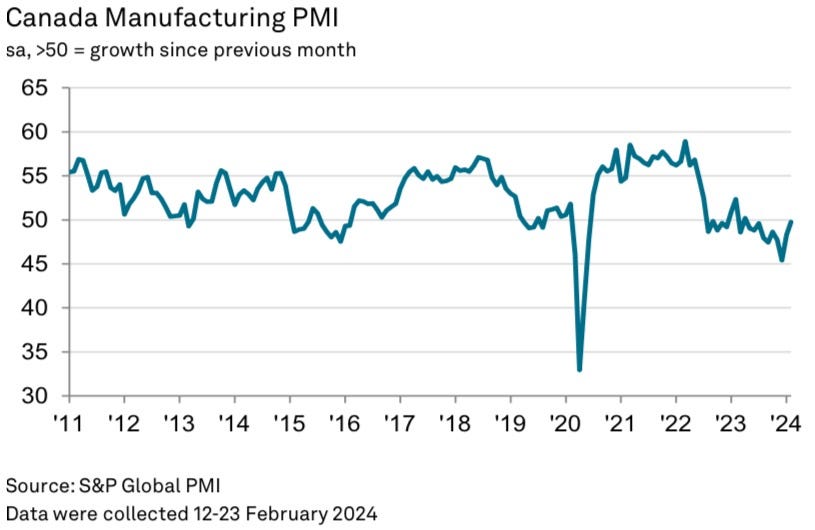
OTHER MANUFACTURING PMI READINGS
Speaking of which, Canada’s Manufacturing PMI for February clocked in at 49.7, perilously close to expansion, have a look at the chart:
Other notable Manufacturing PMI’s this week:

China Caixin was 50.9, up slightly from 50.8 in January. Check.
The official China NBS Manufacturing PMI was 49.1, essentially unchanged from January at 49.2. Check.

Eurozone PMI was 46.5, essentially flat with January’s 46.6. Still bottoming, but no deterioration.

The JPM Global Manufacturing PMI nudged up to 50.3 from 50.2. Check.
It is clear that certain sectors are not pricing in this manufacturing bounce back, hence my focus on copper and steel.
And I continue to seek out more ideas that have leverage to this theme. I was unaware of the leverage oil has historically enjoyed, so I am feeling good about my energy stocks.
INITIAL CLAIMS - AN UPTICK BUT WELL BELOW THE LEVEL OF WORRY

Graph from Liz Ann Sonders.
Initial claims upticked to 215k this week, but we are still well off the levels typically associated with recessionary conditions i.e. 300k +.
There was a noticeable bump in Continuing Claims, to the highest levels since November. Worth monitoring.
Once again there is chatter regarding the rise in WARN notices presaging the inevitable increase in initial claims.
We’ll see.
Frankly, next week is all about the payrolls report on Friday. As it stands, the labour market continues to exhibit resilience.
Consensus expectations for payrolls are 175k, and the closely watched AHE is projected to come in at 0.3%.
As such, the soft landing narrative is the proper theme to guide my investment process.
EZ CPI - FIRMER BUT STILL ON A DOWNWARD PATH

Graph from Krishna Guha EvercoreISI
Core CPI in the EZ was slightly ahead of expectations at 3.1% vs 2.9%E.
The culprit remains services inflation at 3.9% y/y, only slightly below the 4% reading of the previous 3 months. Core goods deflation trend remains in tact.
With the recent uptick in PMI’s and overall labour resilience, the firmer reading likely pushes the first ECB cut out to June (does this sound familiar?).
The hotter reading doesn’t rank with the quite hot US CPI, but it is enough to give the ECB pause, the world’s central banks are terrified of easing too quickly.
CANADA GDP - NO RECESSION BUT UNINSPIRING
Perspective is everything when it comes to economic numbers isn’t it?
With that in mind, Canada’s 1% annualized GDP growth for Q4 looks ok. In fact, it is miles ahead of the BofC’s estimate of 0% growth, so there’s that.
The flash estimate for January of +0.4%, whilst encouraging, seems to be driven by the end of the Quebec public servant strikes. In other word, a one time bump.
Again, tracking against BofC’s 0.5% GDP assumption for Q1, we are off to a decent start.
It is important to remind ourselves of the BofC forecast because the variances will clearly drive the decision on WHEN to cut rates.
There were some notable weak readings for Q4, for example, a large decline in business investment (productivity read through) of 9.5% is not something I like seeing.
On the whole there is no major deterioration, the Canadian economy is not operating at capacity nor is it collapsing.
This supports the path of continued disinflation, but doesn’t create urgency for the BofC to accelerate rate cuts.
If we get another benign CPI, I personally think the BofC would have cover to begin cutting, but most commentators expect June to be the first cut.
Here is a handy table from BMO’s Douglas Porter summarizing the GDP data:

This is the end of the free blog this week. If you continue reading and decide to spend some of your hard earned $$ ($20/month) here’s what’s in store:
Flow Analysis - money flow drives stocks, so it is critical to understand where the $$ are going and where they are being withdrawn. Without this knowledge, it is even more difficult to predict performance.
Charts of the Week - even if you don’t believe in technical analysis, it’s a great way to capture the essence of the week in an efficient manner.
My Portfolio Stock Analysis - this week I cover my satellite/space play, a catalyst for my renewable royalty idea, my core energy pick and some key data that is driving my GLP-1 selection. Lots to get through, and the stocks are working!
Do you really want to miss out on the question of the week??
If this is it for you, I appreciate you reading the blog, and please share it with other folks in your network you believe would enjoy it!
I do post during the week on topics of interest, you can follow me on X (@NSLInvestments), or on LinkedIn or simply on the Substack chat.
If you have questions or want to debate, please reach out, I love to hear from readers.
I wish you the best of luck this week with your investments!