

JUST THE FACTS PLEASE

Hello and welcome to the latest edition of the No Straight Lines Investments blog, thanks for joining me.
The noise level in the market amped up to Motorhead-like decibels with a hotter CPI and more geopolitical tension in the Middle East.
It is challenging to bring absolute clarity in the midst of the cacophony, but I firmly believe focusing on the known is helpful for context and a potential hint of any required adjustments in investment approach.
As of Friday’s close, here are the facts:
Inflation - 3 successive above consensus CPI prints suggests inflation is not going quietly into the night. Whilst it is true that the map across to PCE from CPI/PPI infers a 2.8% annualized PCE for March, the goldilocks narrative of a continued smooth downward path for inflation in concert with a solid economy, is on the sidelines for now. How do I know this? Have a look at what Fed futures are now pricing in (chart from David Kostin GS):
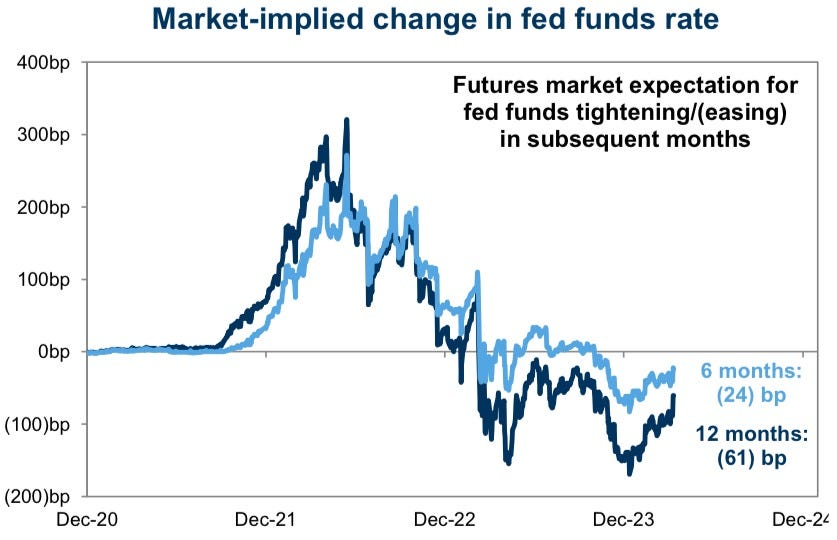
We have swung from 150 bps of cuts priced in to 42 bps now.
Most of the sell side is now assuming 2 cuts for the year, beginning in July.
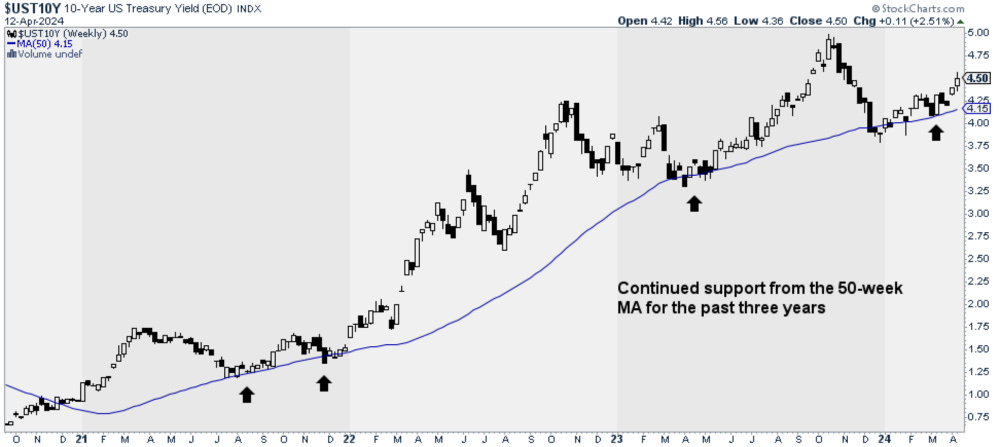
Yields have ratcheted upwards due to better growth in the economy and higher inflation.
Economy - for Q1, the US economy created an average of 276k jobs/month, an acceleration from the 2023 average of 251k (thank you Tony Pasquariello). The most recent GDPNow estimate for Q1 GDP is 2.4%, hardly anemic.
What’s my point?
Ultimately it is the economy that drives stocks and the economic backdrop remains solid.
Are Rate Cuts Needed? - It is not lost on me that JPow’s December pivot prompted the widely held view that the Fed would be cutting rates into a solid economy, which is the literal definition of investor nirvana and led to tremendous equity performance in Q4/Q1.
What has changed?
As shown above, the economy is still doing well, the number of cuts has declined by 2/3+ and inflation is stubbornly hanging around.
The areas of the market that have done well lately would be categorized as inflation beneficiaries: commodities and cyclicals more generally.
Whilst we await more data, I am maintaining my bullish commodity stance.


On to the week’s key macro releases.
CPI - IT IS WHAT WE THINK IT IS!
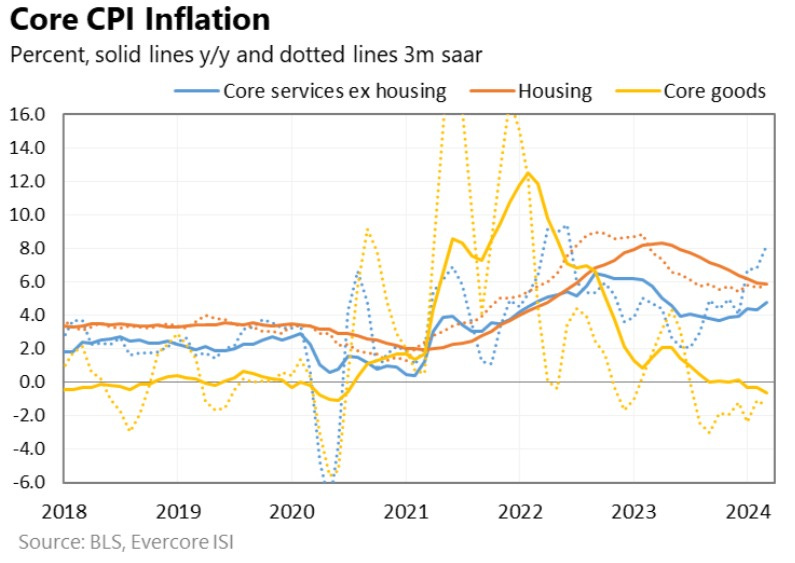

Charts from Krishna Guha EvercoreISI.
There isn’t much sense in attempting to cherry pick good or bad data points out of March CPI, it was overall hotter, exhibiting stubbornly high shelter, still negative goods and a reacceleration in CSEH.
The crucial question we are all wrestling with is: where do we go from here?
Here is a suggestion from Krishna Guha of EvercoreISI, echoed by Mohamed El-Erian:
We think the best way forward would be for the Fed to reframe the moves ahead as an initial 50-75 bps mid cycle adjustment from the mid 5’s to the high 4’s this year based on realized progress on inflation and the forecast rather than spot data points, after which the Fed could see what the world looks like in 2025. Krishna Guha, April 10, 2024.
This strategy would obviously require the Fed to move away from explicit data dependence.
As Guha (and others) have pointed out, consider the scenario where April and May are not directionally lower, this would leave 3, 6 and 12 month inflation data showing limited improvement by July or September.
With strict adherence to incoming data, there is growing risk the Fed stands pat entirely on cuts, in particular as base effects starting in September are much less favourable.
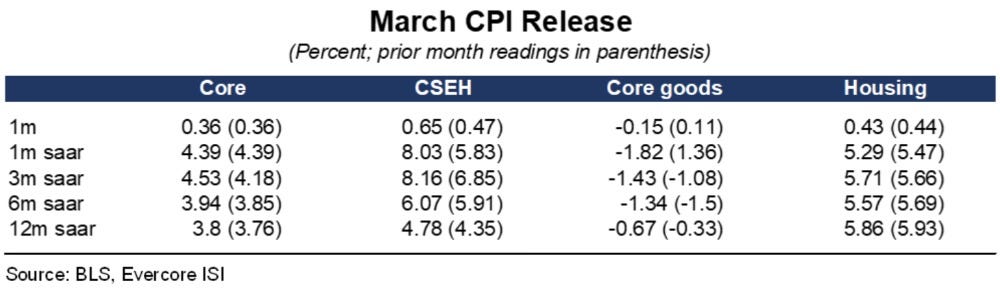
The in-line PPI helps things moderately (I will discuss below), and ultimately the strength of the economy keeps me bullish, but the rate picture is no longer a clear tailwind to equities. For all you data nerds, here is a summary from Krishna Guha.
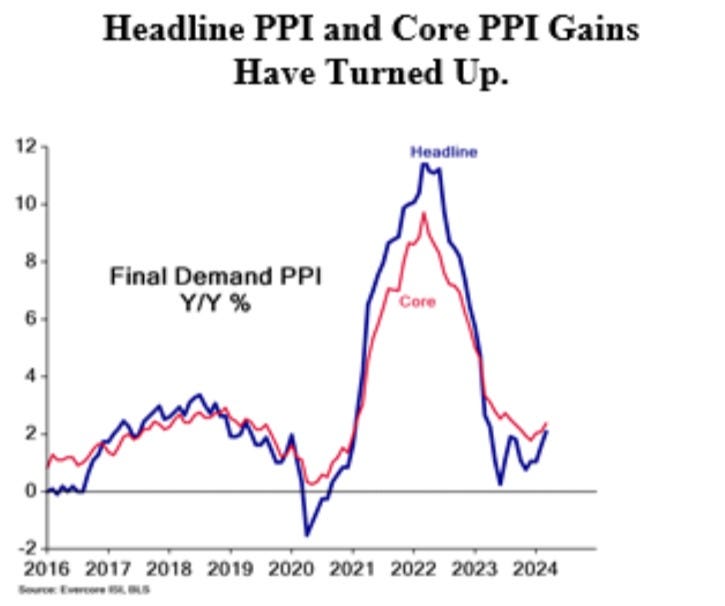
PPI - LESS THAN FEARED
After the higher CPI print on Wednesday, the focus was squarely on the components of PPI that map to the Fed’s preferred inflation gauge, PCE. Core PPI was bang in-line with consensus at 0.2%, and 2.4% annualized. Chart from Stan Shipley EvercoreISI.
Regarding read thru to PCE, here are the revised numbers post PPI of the street’s estimates for PCE in a few weeks (from Nick Timiraos WSJ):
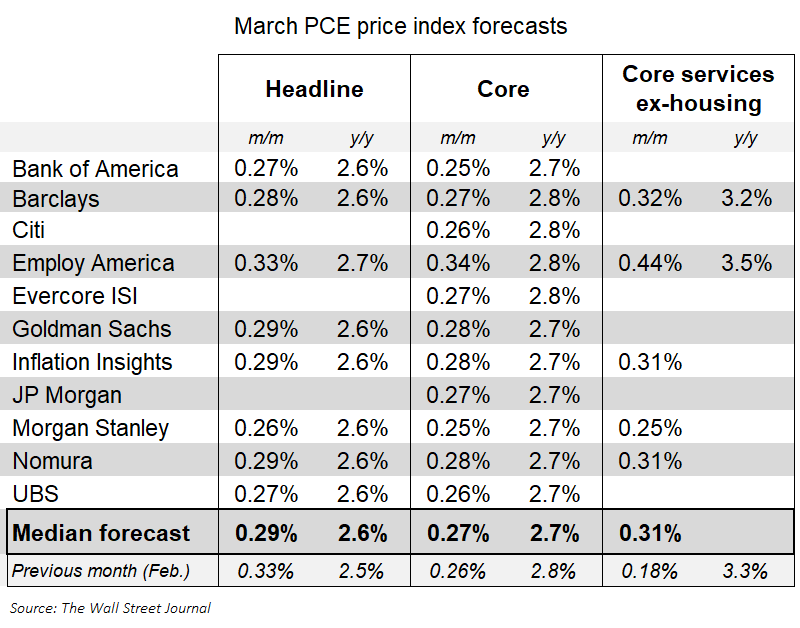
For some perspective on what 0.27% core PCE means, recall that JPow had suggested February’s 0.26% print was more along the lines of what the Fed was looking for.
Krishna Guha argues that a March/April average core PCE <0.25% combined with a benign Q1 ECI (better measure of wage inflation) could still keep a June cut on the table.
Also worth mentioning that Fed Governor Williams stuck to his forecast of 2.25% to 2.5% inflation by end of year, and didn’t hint at any change in his stance.
At this point, a more dovish PCE print for April would be a positive surprise considering the rapid repricing that has occurred in the Fed futures market.
And you don’t want to overreact to any specific data point.
However
Looking ahead, it would seem prudent to regard rate cuts as optional assuming the economy continues to hum along, and to position in equities that benefit from an inflationary and growth tilt.
Thankfully my commodity positions do exactly that.
This could also lead to an opportunity in the TSX overall. More on that below.
INITIAL CLAIMS - NO DENTS IN THE ARMOUR OF THE JOBS MARKET
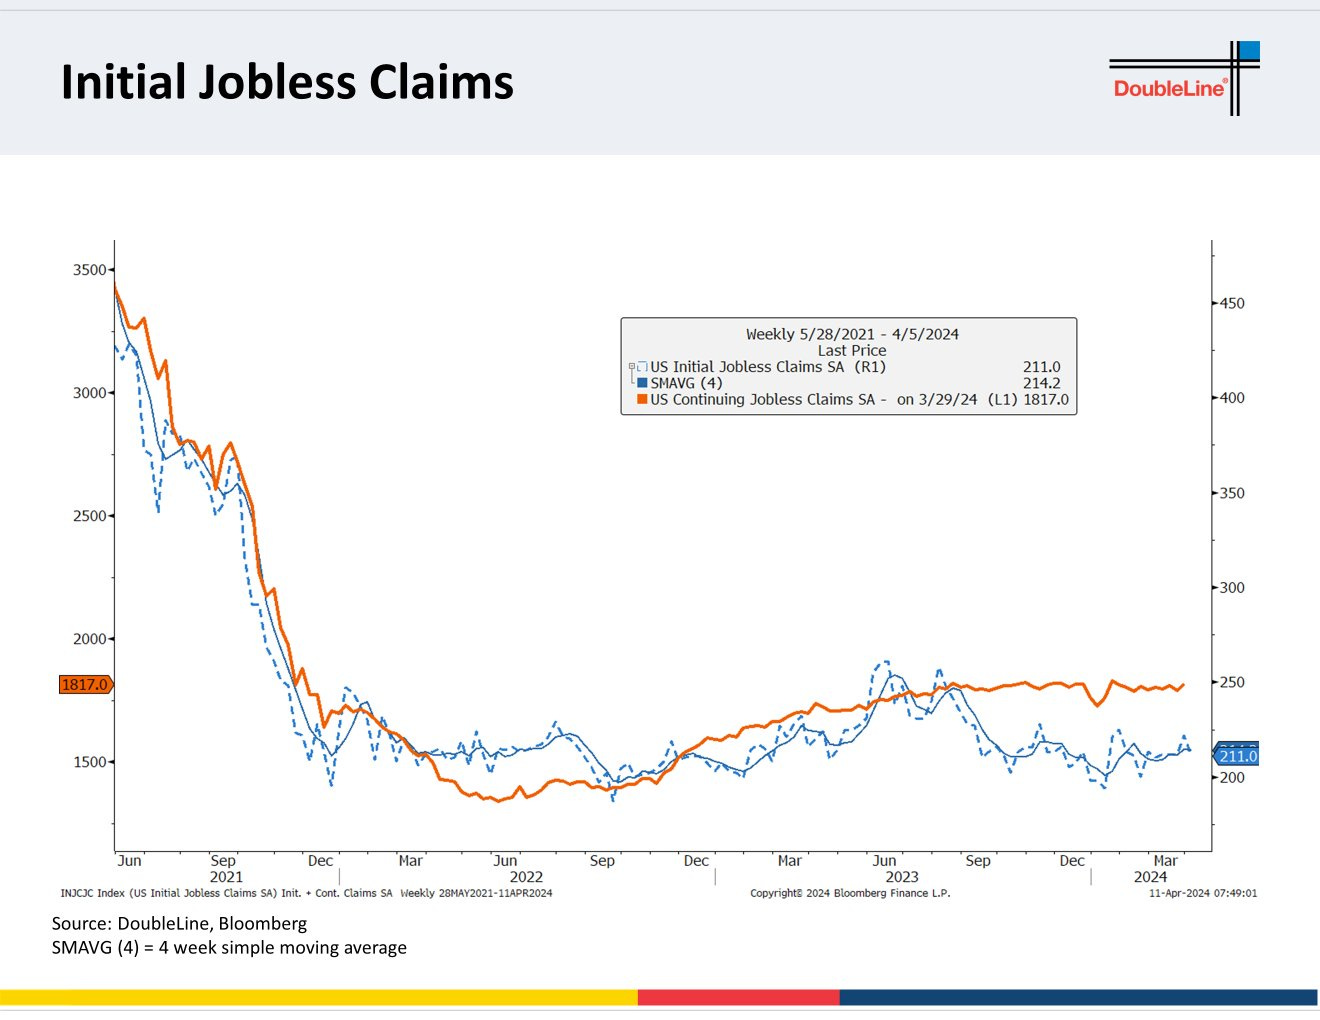
Graph from Doubleline
As you can see, there is not discernible uptick in initial jobless claims, with the 4-week moving average remaining in a low range (214k currently).
There is no amber light flashing from these numbers.
A healthy labour market drives the economy. We are seeing more normalized quit rates, ratio of jobs/unemployed (in-line with pre-COVID levels), which signifies ongoing rebalancing.
The next key data point will be Q1 ECI.
Stay tuned, but the jobs picture remains rock solid.
BofC - MODERATELY DOVISH HOLD
While inflation is still too high and risks remain, CPI and core inflation have eased further in recent months. The council will be looking for evidence that this downward momentum is sustained. Bank Of Canada, April 10, 2024.
To put it more plainly, the BofC needs to see CPI reports similar to what we saw for January/February in order to cut rates in June.
A further fly in the ointment is, of course, the reset that has occurred with the Fed. Make no mistake, the BofC is not keen to unwittingly create imported inflation with a weaker C$!
Also interesting to note that the BofC is not expecting much improvement in inflation in the 1H of 2024, forecasting CPI of 2.9% for Q2, slightly above 2.8% for Q1. It did trim it’s end of year inflation number to 2.2%, which is 0.2% lower.
Here’s a great summary of the changes in the BofC’s MPR forecasts, from BMO’s Benjamin Reitzes:
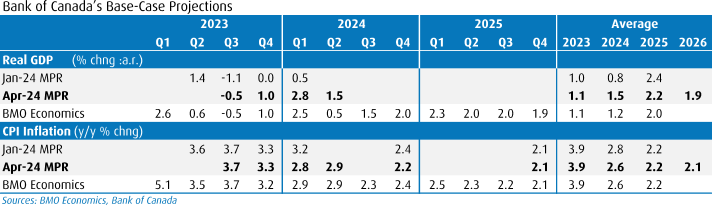
As you can see, overall economic growth has been substantially upgraded. Understanding that the BofC’s accuracy in forecasting has been lacking over the past few years (a fair critique of pretty much every central bank I would suggest).
Governor Macklem, in an interview published in the Globe and Mail on Saturday, reiterated his messages from the Wednesday presser. As it pertains to a rate cut in June:
So we’ll see what decision date that actually happens on. But the message is we’re moving in the right direction. We are getting closer. We’re seeing what we need to see. We just need to see it for longer. Tiff Macklem, April 13, 2024.
Here is a link to the full interview, worth a read: Tiff Macklem
Bottom line is the divergent inflation trends (thus far) point to a possible cut in June.
Coupled with weaker labour and GDP numbers, it is surprising how closely our bond yields are tracking US yields, as GS highlighted last week.
I believe we can still plausibly argue that rate cuts remain firmly on the table and are a tailwind to the Canadian equity market.
CHINA - EXPORTS AND IMPORTS WEAKER THAN EXPECTED

On a $$ value basis, exports were down 7.1% in March against consensus forecasts for a decline of 3%.
Imports were down 1.9% versus growth of 1.2% expected.
We will see Q1 GDP numbers next week, so this week’s release will exert moderate downward revisions to those numbers.
Neo Wang of EvercoreISI (his graph above) suggests the numbers are not as weak as the headline suggests due to seasonal adjustments.
As with all economic figures, I tend to be more interested in trends, and will therefore reserve any hard conclusions until the next batch of import/export data. For Q1, exports and imports were both up 1.5%.
A healthy Chinese economy is vital to the bullish commodity thesis, in particular for copper.
If you want to continue reading, please sign up for my monthly subscription ($20/month).
Here’s what’s in store for you:
Flows Analysis - talk is cheap, you need to follow the $$. Even if you want to move away from the crowd, you need to understand where the $$ are being put to work in the market.
Charts of the Week - a very efficient method to capture the mood of the market over the past week, and a great way to uncover new ideas.
Portfolio Stocks - this week I discuss why the Canadian market looks poised to potentially outperform and provide update comments on the renewable space and my portfolio stocks to play that theme.
Life Hacks - last week we discussed our favourite modifications to current fitness regimes, very enlightening.
If this is it for you, thanks for reading and I wish you the best of luck in your investments this week!
I do post regularly on X (@NSLInvestments), LinkedIn or using the Substack Chat.