

(NO CUTS) LIKE A KNIFE

Hello and welcome back to the No Straight Lines Investments blog, thanks very much for checking in with me.

US 10-year treasury yields backed up 20 bps this week to 4.40% in response to generally stronger data, mostly due to monthly payrolls and better than expected global manufacturing PMI results (more on that below). The S&P finished the week 1% lower, in spite of a solid bounce back on Friday.
Further, the futures market is now pricing in 68 bps of cuts in 2024 in the US. In other words, not quite 3 cuts, hence this week’s title (and a reference to one of my fave Bryan Adams’ tunes).
Two big questions are top of mind for me currently:
When do rate increases become a problem, and the correlation to the equity market turns negative again?
According to Ben Snider from GS, a 2 SD monthly move in rates would, historically speaking, cause an upset to the upward drift of the equity market. In the current market, that is a 60 bps move, or 4.8% on the 10-year. (also credit to Tony Pasquariello of GS).
Are we in for a catch down from the market leaders?
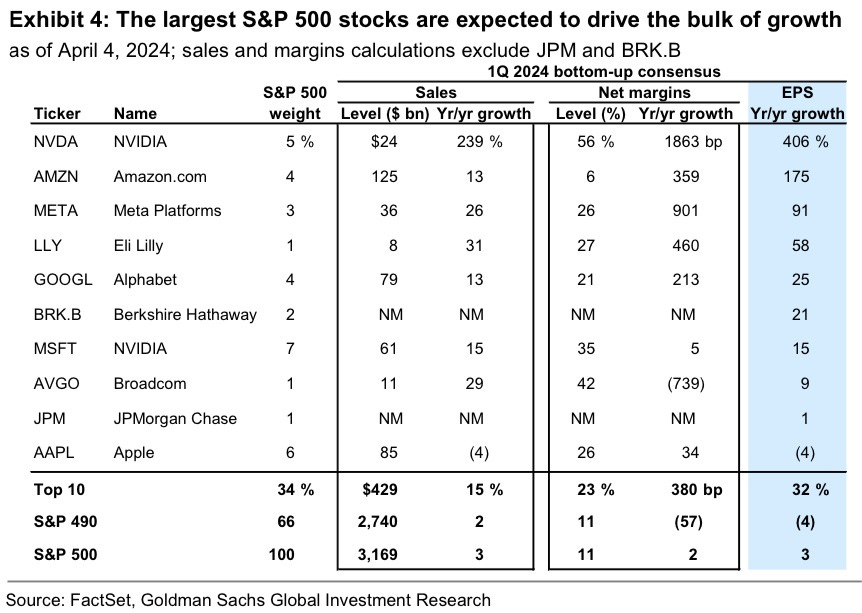
I have spent quite a bit of time (as has most every market watcher) assessing the achievability of estimates for the Mag7, mainly because of tables such as this one from David Kostin of GS:

When earnings growth and market cap is as concentrated as it currently is (see chart below from David Kostin), there is a higher probability of a “catch up” from the remainder of the index constituents rather than a sell off in the leaders. Thank you for this tidbit, Mr. Kostin. In this case, I hope history repeats itself!


Let’s discuss the most influential macro releases this week, shall we?
US PAYROLLS - BIG BEAT WITH NO OBVIOUS TIGHTENING IN LABOUR SUPPLY

The conclusion is that the labour market is very healthy, with payroll additions of 303k blowing past 214k consensus, and, bucking a year long trend, revisions to prior months were net positive 22k.
The 3-month moving average, as you can see in the above graph from Krishna Guha of EvercoreISI, is moderately upward sloping at 276k.
Mr. Guha believes the market overreacted to the upside payrolls surprise. Here is his rationale:
We estimate labour supply is growing at 200k/month on average, possibly more (taking into account the lagged effect of workers who arrived in 2023) such that a 303k print - though very strong by any measure - is more like a 200k print benchmarked against normal labour force growth of 100k.
In this context while the Fed might rightly put some weight on the strength of payrolls it will put more weight on the measures of tightness - the balance of supply and demand - including unemployment and wages.
These series did not show any appreciable signs of renewed tightening that might make it harder to bring inflation back to target. Krishna Guha, EvercoreISI April 5, 2024
If Guha is correct, the strong payroll gains simply give the Fed an excuse to be patient.
And looking at the adjusted rate cut expectations, the market seems to have received the message.
AHE’s clocked in at 4.1% annualized and the U-rate dipped modestly to 3.8%.
A couple more charts to reinforce the return to balance in the labour market:


You can see quits rate is actually slightly below the prepandemic average, and job openings at 1.4 is moderately above the pre-COVID average of 1.2.
The March jobs report reinforces the soft landing narrative. All eyes on CPI and PPI next week, the strong payrolls give the Fed the potential to cut from a position of strength.
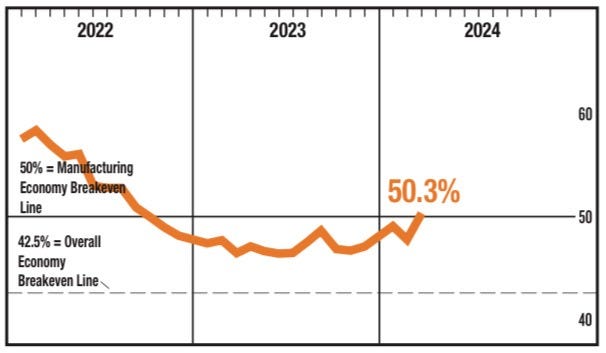
MANUFACTURING ISM - WE HAVE LIFTOFF!
NEW ORDERS

PRODUCTION

Tim Fiore, Chair of ISM Manufacturing survey had this to say:
The U.S. Manufacturing sector moved into expansion for the first time since September 2022. Demand was positive, output strengthened and inputs remained accommodative…..Demand remains at the early stages of recovery, with clear signs of improving conditions. Production execution surged compared to January and February, as panelists’ companies reenter expansion. Tim Fiore, April 1, 2024
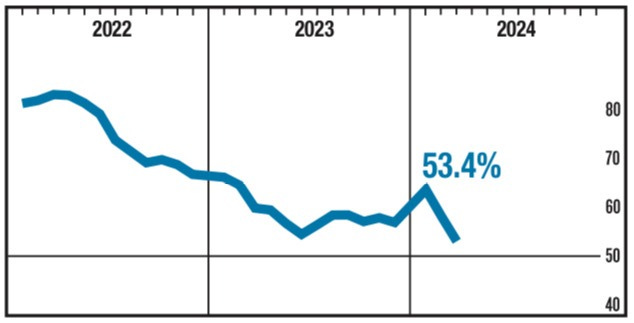
One month does not signal a trend, but this is a very healthy development for the US economy, especially as ISM services clocked in at 51.4, still expanding, but at a slower pace (see below).
The strength in the survey was a key factor behind the rally in copper this week. As I have previously discussed, DM (US/Europe) Manufacturing was the biggest drag on copper performance over the past 12 months, so the expansionary reading in the US is a definite tailwind.
GLOBAL MANUFACTURING IMPROVES
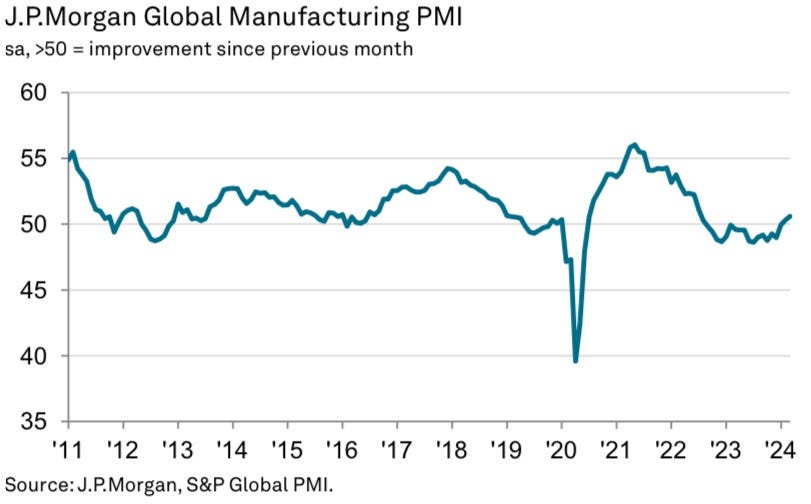
Global manufacturing picked up in March to 50.6, from February’s 50.3.
In terms of influence, India, the US and China clocked in as the 3 leaders. US growth was at a 22 month high (see above) whilst China registered the best growth in 10 months.

Confidence for the Canadian manufacturing sector remains elusive, but the overall reading of 49.8 is a one tick improvement over February’s survey. Let’s see if a dovish turn by the BofC next week spurs more confidence?
SERVICES ISM - SLOWER BUT SOLID
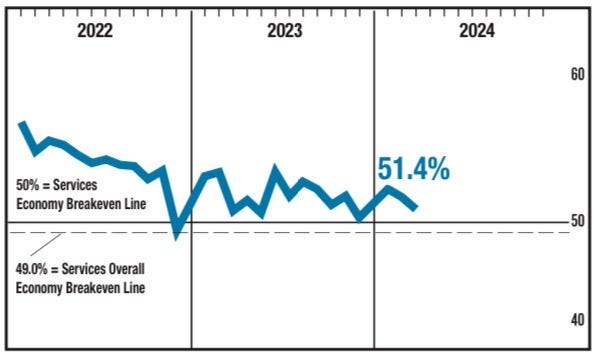
The services side of the US economy slowed somewhat in March according to the ISM survey, registering 51.4 against February’s 52.6 reading.
PRICES PAID
A welcome drop in the prices index augers well for future services inflation readings.
Overall a solid read on the services side of things. Combined with the better manufacturing result, the US economy is in good shape.
EUROZONE AND CHINA SERVICES SOLID
China services PMI came in at 53, which is a 9-month high, and the EZ services reading was 51.5, the strongest reading since last June.

Unfortunately, Canada’s services sector continues to slump, 46.4 for March versus 46.6 for February. Interestingly, many survey participants are awaiting a rate cut from the BofC. Are you listening Mr. Macklem??
It is clear from these surveys that the global economy is on the mend, albeit with significant variance between the countries. Supportive for equities, and in particular, commodities.
CANADA JOBS - NO SILVER LININGS HERE

If you are rubbing your eyes to make sure you are reading the numbers correctly, don’t bother, Canada DID, in fact, lose 2.2k jobs in March.
There was also a rather dramatic rise in the U-rate to 6.1%, due once again to the large increase in population (91k) for the month, according to Douglas Porter of BMO, who also gets credit for the above table.
Finally, in spite of the negative job reading, wages were still too hot, showing 5.1% y/y growth.
In terms of what this means for the BofC rate decision next week, I think it’s pretty simple. We have had consecutive cooler than expected CPI prints, GDP has proven to be resilient, and the jobs market is looking, at a minimum, well supplied.
Tiff Macklem isn’t going to surprise us with a rate cut, but I would expect more dovish language in the accompanying statement. A leaning to cut would do wonders for business confidence in Canada, needless to say, and I suspect waiting any longer will be a HUGE policy mistake.
Just as an aside, does it make sense that markets are pricing in the same number of cuts in Canada as in the US, given the divergent economic performance, not to mention the much more benign inflation prints in Canada? Check out this graph from Joseph Briggs of GS:

So both Canada and US have 65ish worth of rate cuts priced in. Appears too hawkish on Canadian pricing, I guess we shall see.
EZ INFLATION - COOLER PRINT = JUNE CUT ON TRACK

EZ core CPI came in at 2.9% versus 3.1% in February.
Services inflation remains sticky at 4%, with 3-month annualized declining to 4.1% and 6-month annualized increasing by 2 ticks to 3.5%.
The key takeaway is that an April cut is off the table based on still elevated services inflation, but the ECB is on track to cut in June.
As I have stated previously, cutting rates amidst a non-recessionary backdrop is a tailwind to equities, full stop.
That’s it for the free portion of this week’s blog. I encourage you to sign up for the paid blog, it’s $20 CAD/month, which is suspect is less than many of you spend on coffee per week?!! The full blog is meant to be a curated one-stop-shop of macro analysis which feeds into stock selection. Without the full picture, you are flying blind IMHO.
Here’s what you’re missing:
$$ and Trading Flows - whilst sentiment is important, the real market intelligence is gleaned from following the $$. Some very interesting sectoral flows this week!
Charts of the Week - if you want to efficiently get a sense of the week that was in equity market, this is a great place to start.
Portfolio Stocks - deep dives into the stocks I own. This week we update a key energy holding along with a refreshed look at some key drivers in the materials. I also continue my work on the utility sector. The unweighted average return of the stocks I have written about is 30.7%, spread across 25 initial missives. You might just find a stock that justifies more work on your end?
Life Hacks - every week we cover a topic that resonates with me in the hope that it connects with you. Meant to be very interactive, it ain’t all about stocks folks!
If this is it for you, thanks for reading and good luck with your investments this week!
You can follow me on X (@NSLInvestments), or LinkedIn or on the Substack Chat. I post during the week on topics that I think are relevant in the equity landscape.