

RATES UP = MARKET DOWN

Hello and welcome back to the No Straight Lines Investments blog, I am grateful you have joined me here for another interesting week in the markets.

In a complex environment, it is helpful to attempt to keep things simple. The most recent rally in equities was ignited by the rally in bonds. After 9 straight weeks of gains, sure, we were due for a breather.
Is it coincidental that this week’s 1.5% decline in the S&P 500 was accompanied by a 16 bps increase in the 10-year treasury, which closed at 4.04%?
I think not.
In fact, you can see the rather striking negative correlation between yields and equity prices in the above chart, with thanks, as always, to the chart wizardry of the Bay Street Doctor.
As pointed out by the Doc, correlation changed completely mid-year.
In other words, follow the rules…..until they change!
A big part of the challenge in seeing higher overall index levels stems from this simple question: what makes yields go lower from here?
As an interesting aside, only 18% of respondents to BofA’s December Fund Manager Survey expect lower yields in 2024. Huh?
Let’s dig into the key factors that drove yields higher on the week.
DECEMBER US PAYROLLS KEEP SOFT LANDING ON TRACK
Upon release of December’s 216k jobs number, the 10-year gapped up to 4.09%, a full 10 bps higher than Thursday’s close. See the chart from Gregory Daco showing the jobs trend over the past 2 years.
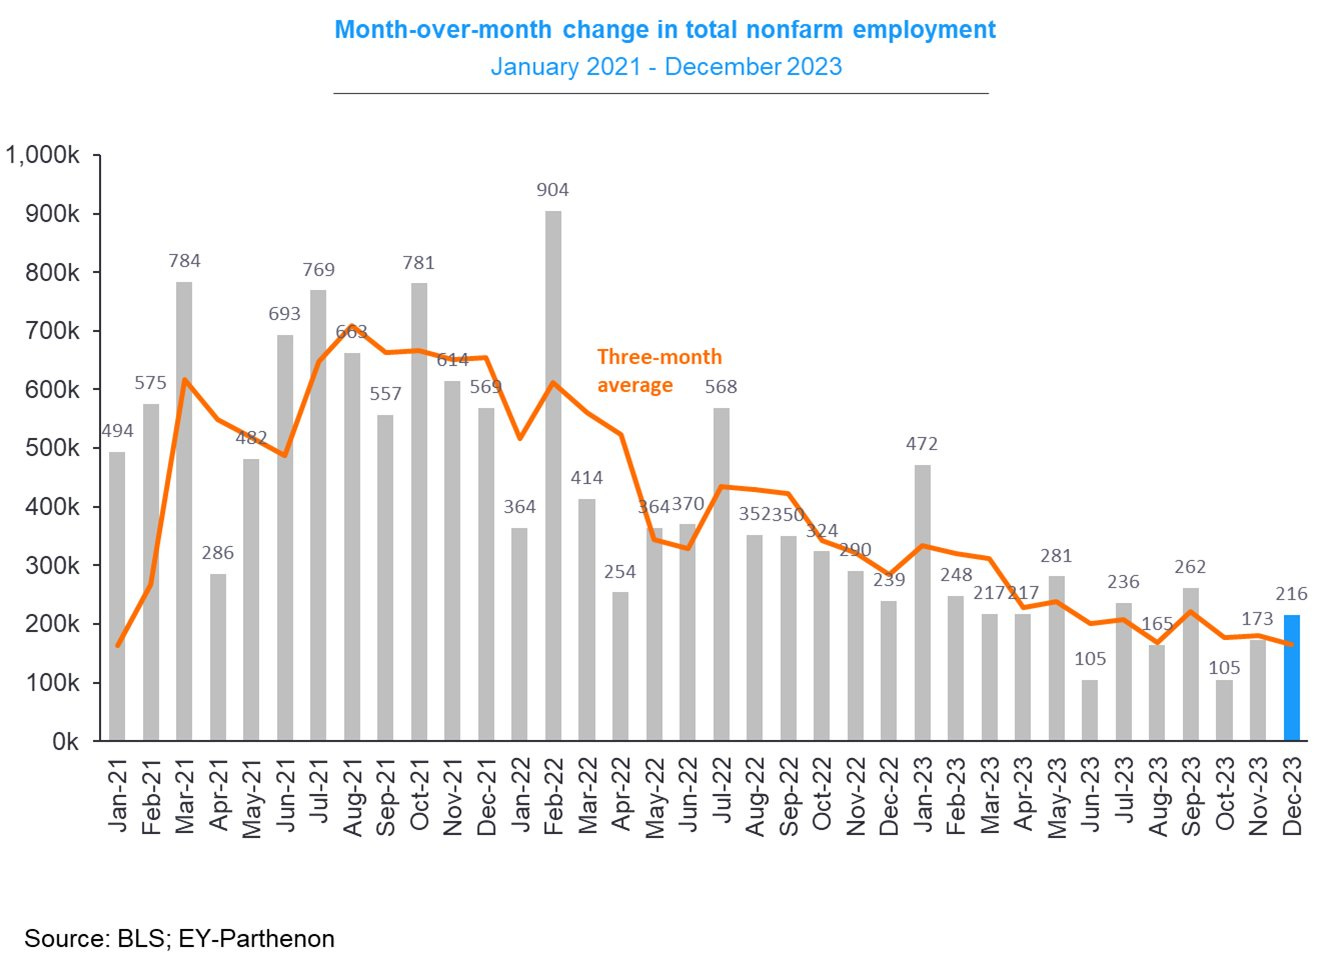
As I have stated repeatedly, I am less focused on the monthly prints as I am on the trend. Hence I am not as fussed as some commentators about the negative revisions for October/November. The monthly noise gets factored into the trend we see in the above chart.
The 3-month average payroll gain is 165k. The so-called breakeven employment rate is 100k. The average monthly gain for 2023 is 225k.
Remember folks, we WANT a slowdown in the numbers, to keep inflation on the declining trend.
Not enough emphasis is being placed on the fact that a slowdown is what we are hoping for. Likely because our financial brains are wired to think that any slowdown is bad news.
The drop in labour force participation is not what we want to see, some have suggested this creates an artificially low U rate, which was unchanged at 3.7%. Again I will say I am watching the trend.

Wages were hotter than expected, reaccelerating to 4.1% y/y growth.
Overall I would suggest the December jobs report supports a solid end to Q4 for the US economy and an in-tact soft landing.
Will be interesting to see GDPNow estimates next Tuesday. Current estimate is 2.5% for Q4.
Remember when there were concerns (in October) that Q4 would be a pothole?
ISM SERVICES WEAKER
When 2/3 of economic activity is tied to services, we need to carefully monitor the ISM Services results.
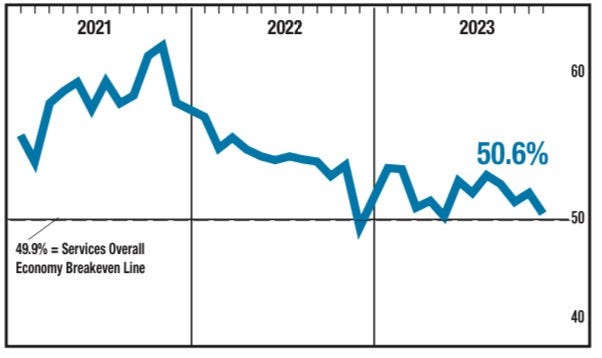
The reported number was lower than the 52.5 consensus expectations.
The most troubling aspect of the release was the Employment Index dropping to 43.3, see the graph.
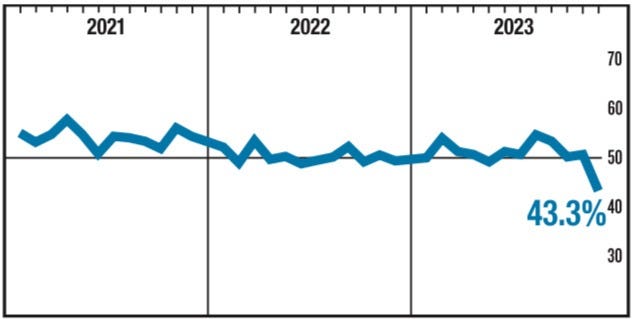
I am thinking this could be an anomoly, as 7 industries reported employment growth, and 8 industries reported contraction.
One corollary benefit is that services wages (which have been stubbornly sticky) could be due for some relief based on the weaker December reading. Stay tuned.
No surprise, the weaker reading led to a quick decline in yields to 3.95%, before the sell off resumed.
For now the services economy remains in expansion territory.
ISM MANUFACTURING - BOTTOMING CONTINUES
As most of you folks are aware, I like copper in 2024 (and steel). One of the keys to copper is the DM manufacturing economy recovering.
On that front, the December US ISM Manufacturing survey was a good start, registering 47.4 against November’s 46.7 reading. Have a look at the chart.

This is the 14th consecutive reading below 50, how is that a good start??
In looking for silver linings, the Production Index, Backlog of Orders and the Employment Index made some nice gains (albeit with the latter 2 readings still in contraction).
Also worth highlighting that Tim Fiore, Chairman of ISM Institute, expects the New Orders component of the ISM Manufacturing survey to jump to 55-60 as the Fed initiates rate cuts. VERY interesting. New Orders cascades into the other aspects of the manufacturing economy.
For perspective, New Orders were 47.1 for December’s survey.
Also worth noting that the bulk of the survey was conducted BEFORE the Fed pivot on December 13.
For the first time in awhile, there was a 3 to 1 ratio of positive over negative viewpoints on the future (among survey respondents). A loosening of monetary policy should brighten further assessments of what 2024 will look like. Tim Fiore, ISM Institute, January 3, 2024
Notable to me that the Atlanta Fed upped their GDPNow Q4 estimate post the ISM reading to 2.5% from 2%.
EZ Reading Shows Modest Improvement
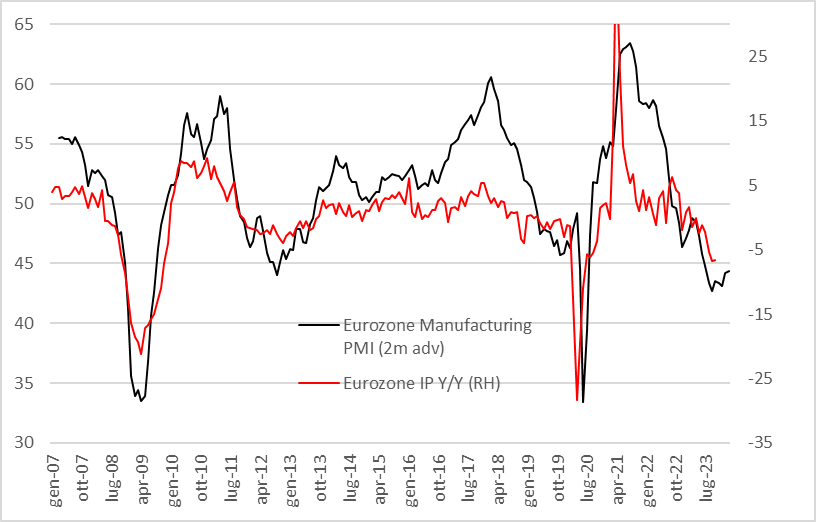
You have to squint to see it, but EZ Manufacturing PMI ticked up for the 3rd consecutive month, to 44.4 from 44.2.
Same logic applies in EZ as in the US, rate cuts will be a tailwind to the manufacturing economy.
We are not there yet obviously, but watching closely.
INITIAL CLAIMS
This data series always takes the backseat when monthly payroll numbers are released.
Nonetheless, 202k claims is indicative of a solid labour market, and is a real time reading for January.

I wanted to use Ed Hyman of EvercoreISI’s graph of claims to illustrate how low claims are relative to history. Pretty much rock bottom.
This doesn’t look like a labour market in distress.
CANADA JOBS
In keeping with my comments about US payrolls, I am not super focused on any one monthly data point.
The key fact I want to highlight is that Canadian jobs grew at an average of 23k/month in the 2H of 2023. This is approximately half the 1H growth rate of 48k/month.
Wage inflation reaccelerated in December to 5.4% y/y, from November’s 4.8%.
So a sticky wage inflation reading with a less than stellar jobs number isn’t ideal.
The BofC has commented that 4%+ wage inflation is not compatible with the Bank’s 2% inflation target unless it is accompanied by labour productivity improvements. Tall order given that Canada has the weakest labour productivity in the G7.
With the economy clearly in a stall, I still believe the BofC will cut rates by April.
I found this graph to be shocking. Credit to Douglas Porter of BMO, is anyone else’s jaw hanging open?
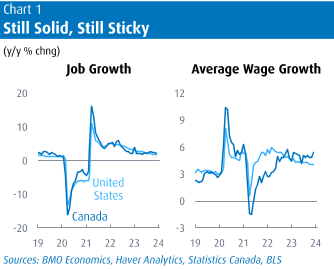
I would have guessed there was a rather large gap between US and Canada job growth. The tracking of the two labour markets is nothing short of remarkable.
At this point you need to question why the BofC would NOT cut rates?
Roughly 1/3 of the current CPI is due to higher mortgage interest.
If that sounds circular it’s because it IS!
The Canadian economy is levered to real estate, lower rates will help that part of Canada’s GDP.
Enough said, hopefully Mr. Macklem and crew read NSL!
EZ INFLATION DATA STILL BENIGN

The chart says it all doesn’t it?
It was highlighted in most of the commentary that easy y/y compares will be removed in February and March. Will be interesting to see how the market reacts.
For now, the decline in inflation paves the way for rate cuts.
I should point out that roughly 20 bps of rate cuts have been priced OUT of the Eurozone since the beginning of the year.
Here ends the free portion of the blog. If you decide to read on (and I obviously ENCOURAGE you to do so) here’s what’s ahead:
Flow analysis - it’s crucial to understand where the $$ are moving and what the trading desks are seeing, you are flying with one eye covered otherwise.
A deep dive into a super important investment theme for 2024.
Charts of the week - always some interesting takeaways for the week ahead.
If this is the end of the blog for you, thank you for reading, I genuinely appreciate it. Best of luck with your investments this week!
If you have any feedback or ideas, reach out to me on the Substack Chat feature.