

THE SONG REMAINS THE SAME

Hello and welcome back to the No Straight Lines Investments blog, I am grateful you have joined me as we navigate through another super interesting week in the markets.
This week’s title serves dual purposes; namely, an homage to one of my favourite bands, and also a nod to the fact that the narrative of better inflation data combined with solid consumer spending readings still points to a soft landing.
Let’s dig in!
PCE - ACCORDING TO SCRIPT
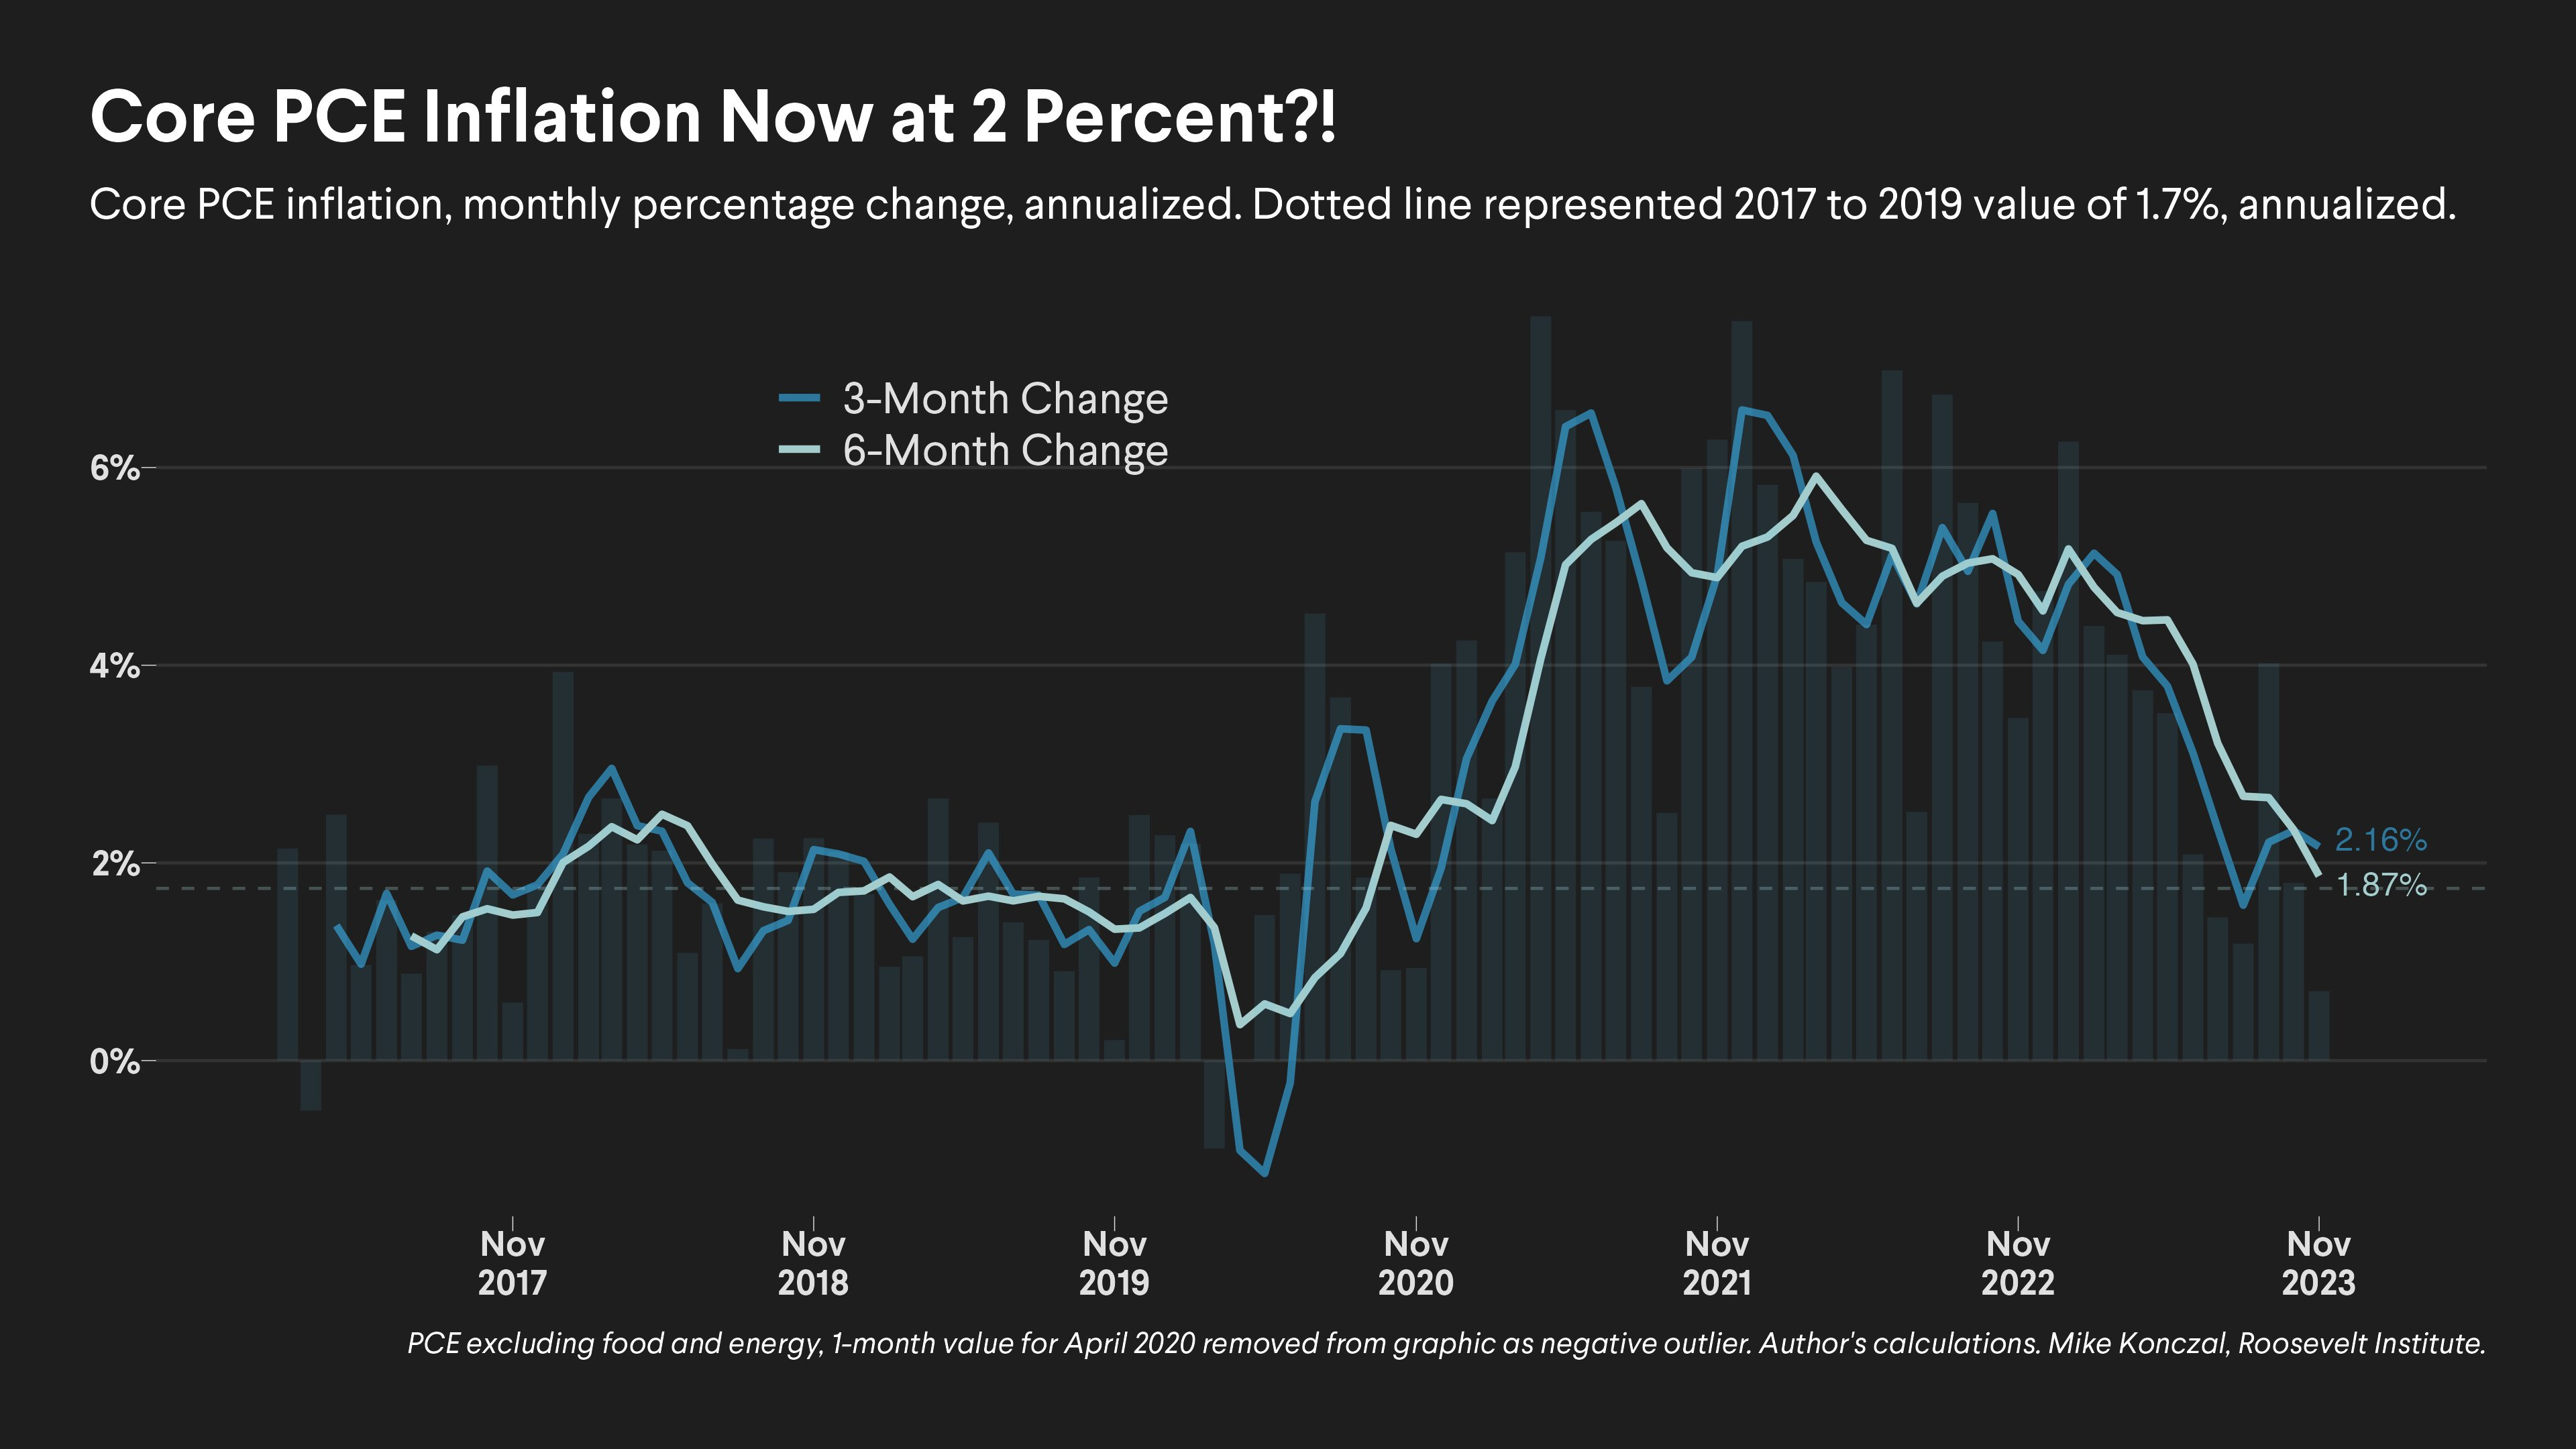
I have been looking for ways to be less sanguine about the PCE inflation data, but I honestly came up empty. The fact is that 6-month annualized core PCE is at 1.87% i.e. BELOW the Fed’s 2% target. Period. (graph from Mike Konczal). Just for context, over the previous 6 months PCE rose at 4.5% annualized.
Further, for those that don’t believe the Fed should be cutting rates as early as March, have a look at this graphic from Charlie Bilello. We haven’t been this restricitve since October of 2007!

The general view is that there is room for further lower readings as both used vehicle pricing and housing rents are in downtrend.
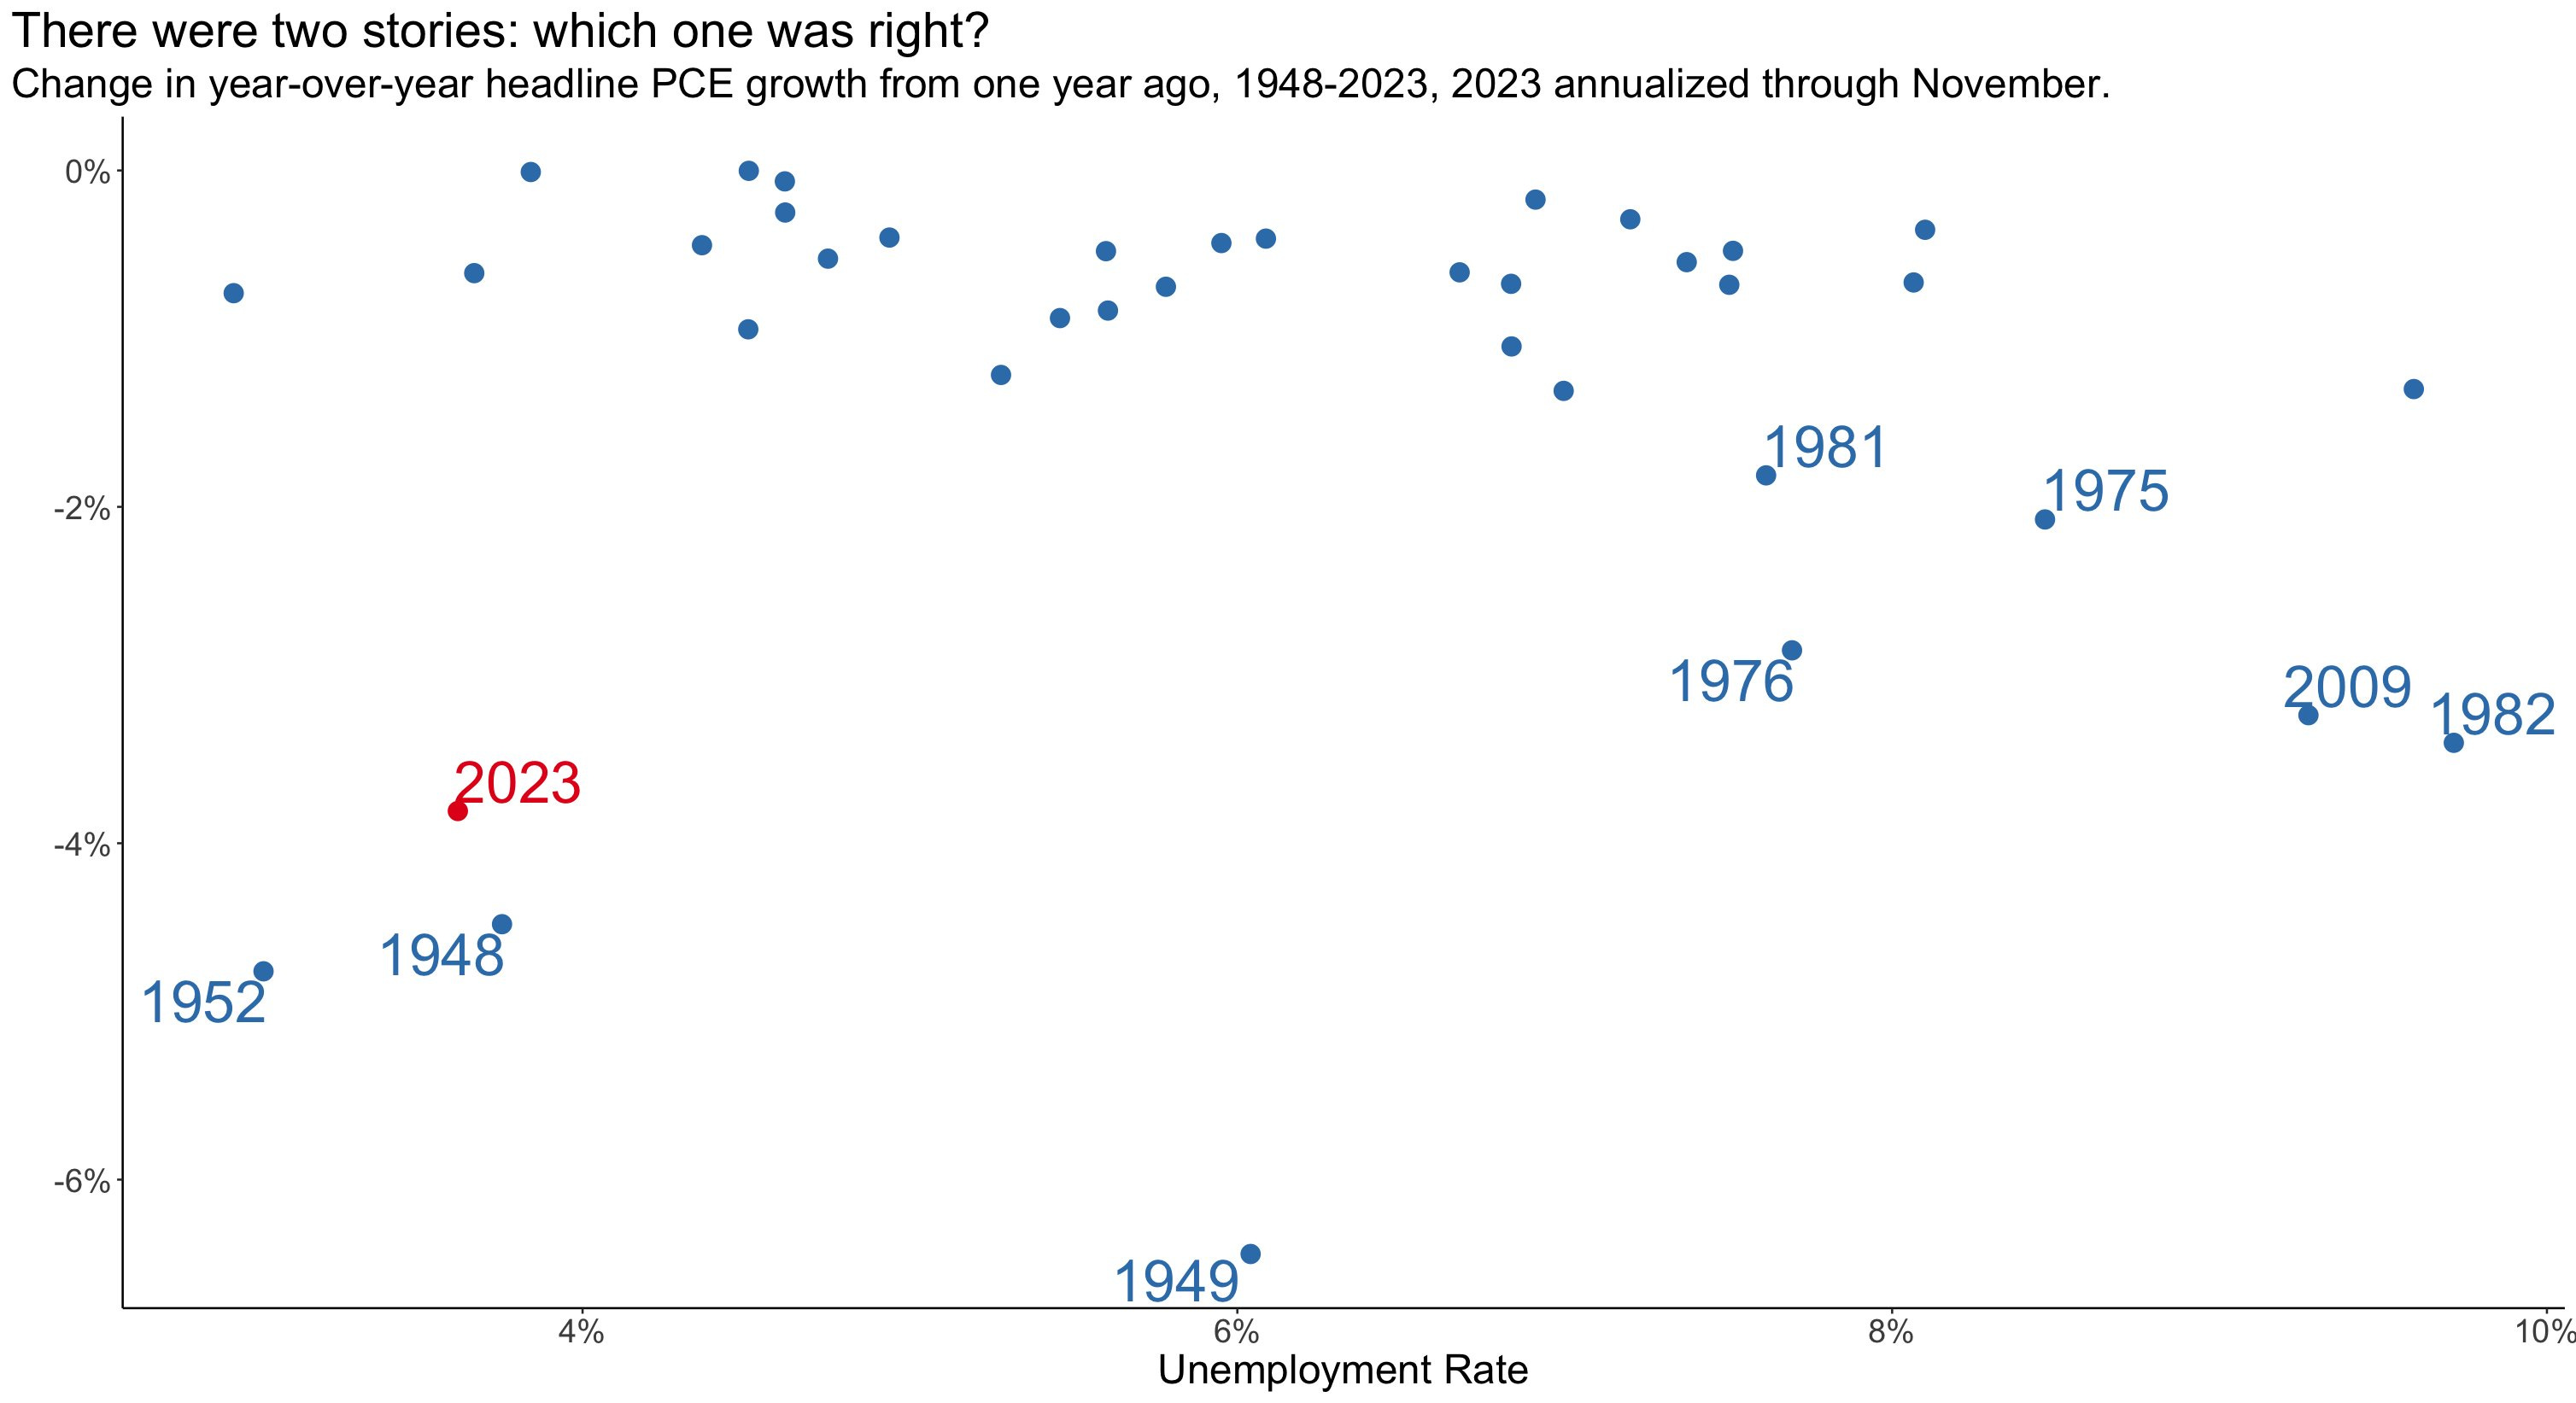
Final chart I wanted to share comes from Mike Konczal. I think this one is really cool. There has been lots of debate about whether the inflation battle would mirror the 1970’s, which, as most of you know, wasn’t awesome for equities. This dot plot suggests the experience (so far anyway) mirrors the 40’s/50’s, which was due to supply side improvements (sound familiar?). Have a look:
The bottom line is that the Fed’s preferred inflation measure is trending (or at) the 2% target and the economy is chugging along. The Fed should be cutting by March.
PERSONAL INCOME/CONSUMPTION
We all know the US economy is 2/3 driven by the consumer, so we need to pay attention to these statistics.
Personal income was up 0.4% and consumer spending was up 0.3% in real terms, both ahead of expectations.
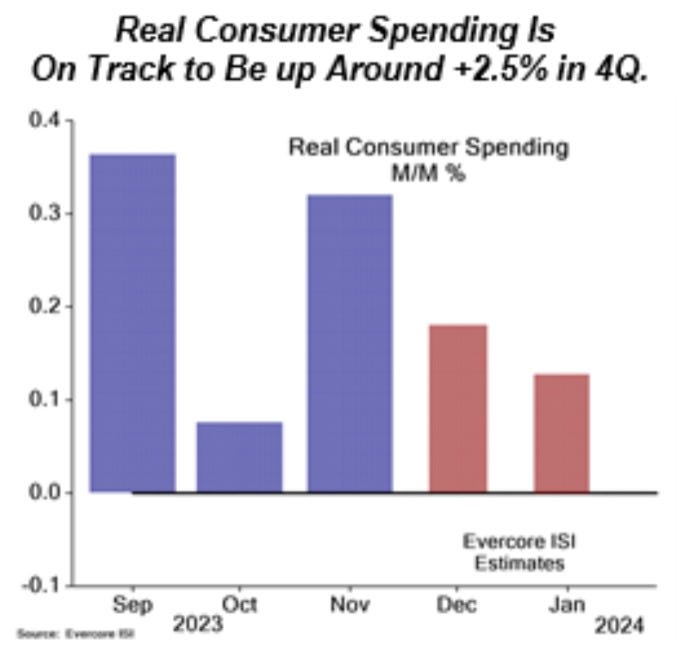
As you can see, EvercoreISI is forecasting 2.5% spending growth for Q4, hardly recessionary.
INITIAL CLAIMS
The low level of initial claims throughout the month of December suggests that payrolls will post another solid number next week. EvercoreISI is forecasting 150k new jobs, with upside risk.

That is not a chart on the verge of an upside breakout. A steady labour market remains the key ingredient to the soft-landing narrative. We are not close to the 300k/week danger zone on initial claims.
EURO/UK CPI READINGS CONTINUE THE TREND

Looking at this graph, it is slightly difficult to suggest that the inflationary spike was anything but transitory. Around this time last year, such a suggestion would have been regarded as heresy. What a difference a year makes.
Eurozone CPI came in-line and UK CPI was lower than expected.
Sound familiar?
The benign readings pave the way for rate cuts to happen sooner in both the EZ and the UK.
Without question a tailwind for equities.
CANADA CPI
Canada’s CPI came in slightly hotter than expected.
However
Inflation Ex-shelter is 1.9%.
In fact, of the 3.1% CPI, 1.13% (so bascially 1/3) of CPI is driven by mortgage interest, which, you may have determined, is due to the rate hikes from the BofC. A bit circular no?
As highlighted by David Parkinson in the Globe&Mail, in examining the deliberations from the BofC’s recent meeting minutes, it is clear that BofC governors are very concerned about the “supply” of shelter and that cutting rates too soon would exacerbate the supply issue.
To me this doesn’t make a whole lotta sense.
The BofC can justify rate cuts just based on the rest of the CPI basket being at target.
Adding to the justification the fact that mortgage interest is such a large part of the current CPI just makes the decision a layup, in this blogger’s humble opinion.
Clearly the market agrees, as there is over an 85% probability of a cut priced in for April next year.
CANADA GDP
Just to add fuel to the rate cutting fire, GDP for October was flat, posting the 3rd straight month of zero readings.
The Canadian economy is struggling to get going with the burden of higher interest rates, unlike our neighbours to the south (GDPNow estimate for Q4 US GDP revised up to 2.7% this week).
The per capita figures are even more dismal due to surging population growth.
The bottom line here is that the BofC is playing a bit of a risky game here, and shud start cutting rates early in 2024.
Here ends the free portion of the blog. If you decide to continue (and you should!), here’s what’s in store:
I will introduce a new position in my portfolio. I also close out another of my positions as it is up 100% since I initiated the idea in July. And I will also reveal a current position that I have increased in size.
Weekly flow analysis, where there were some surprising tidbits which frankly I believe are bullish.
Charts of the week!
If you are finished with the blog for this week, thanks for reading, I truly appreciate it. And I wish you all the best for 2024!