

WHAT LIES BENEATH (THE INDEXES)?
WHAT LIES BENEATH (THE INDEXES)?

Hello and thanks for reading this week’s edition of the No Straight Lines Investments blog, I am grateful for your time and attention.
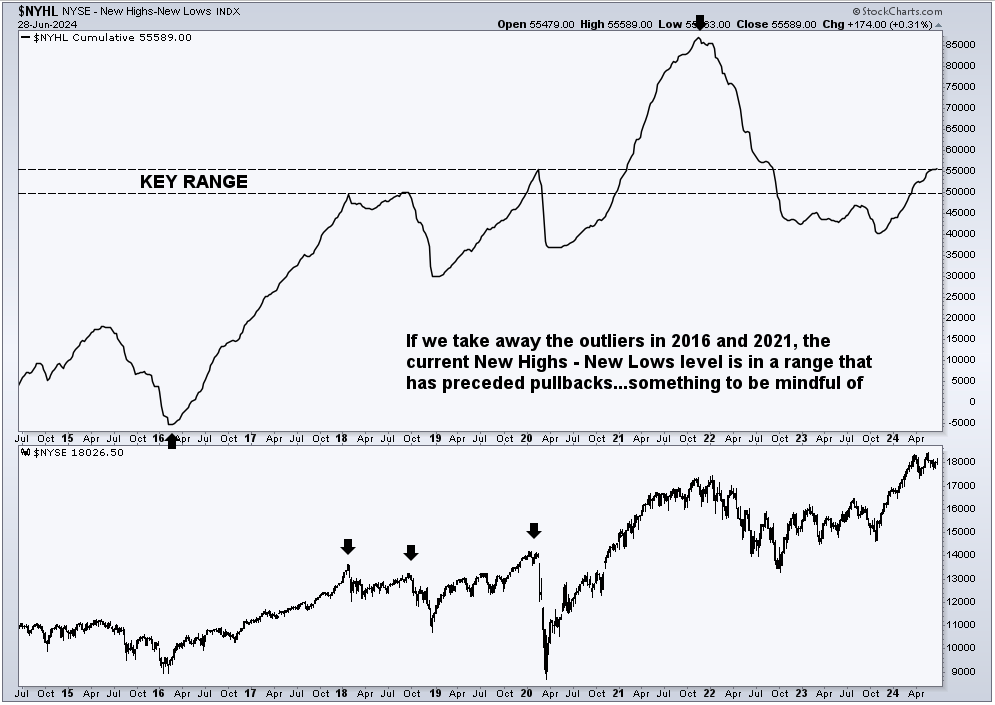
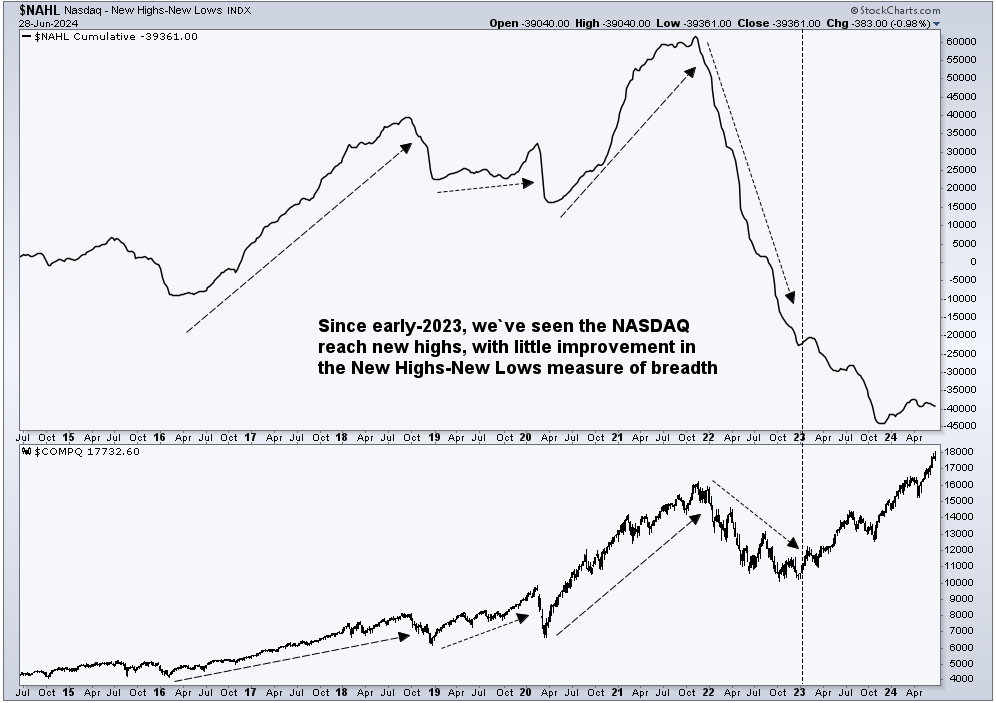
The narrow breadth narrative continues to be top of mind for investors, and you can see from these first 2 charts that we are at levels that have corresponded with some weaker action in the indexes.
Even the generally bullish Tony Pasquariello of GS, who writes a must-read weekly market note, has suggested that now is a good time to tap the brakes on the market.
This week’s title is my shameless homage to the horror film from 2000, meant to highlight another key narrative in the market; namely, the almost record low correlation at the index level combined with extremely high individual stock volatility.
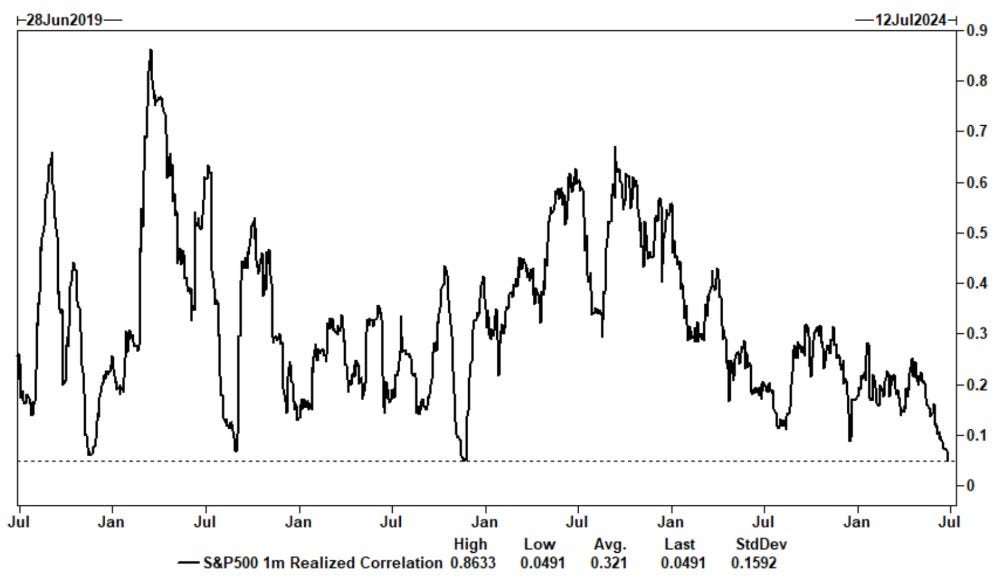
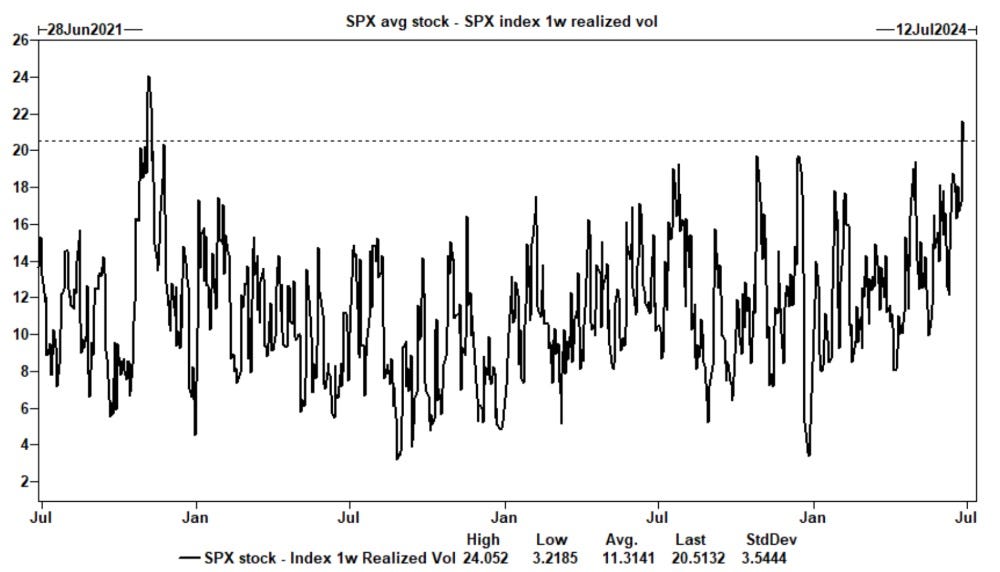
Both charts from Goldman Sachs Weekly Rundown
As you would imagine, this specific situation has been exploited via so called dispersion trades, the unwind of which could lead to exacerbated downside during an unanticipated negative market event.
From my seat, it simply reinforces the notion that stock selection remains at a premium.
I will highlight several examples of outsized stock price moves in this week’s Charts of the Week to further emphasize my point.
We have now closed the books on the 1H, and index performance has been rather remarkable. Ryan Detrick posted an outstanding chart on X yesterday that is worth sharing:
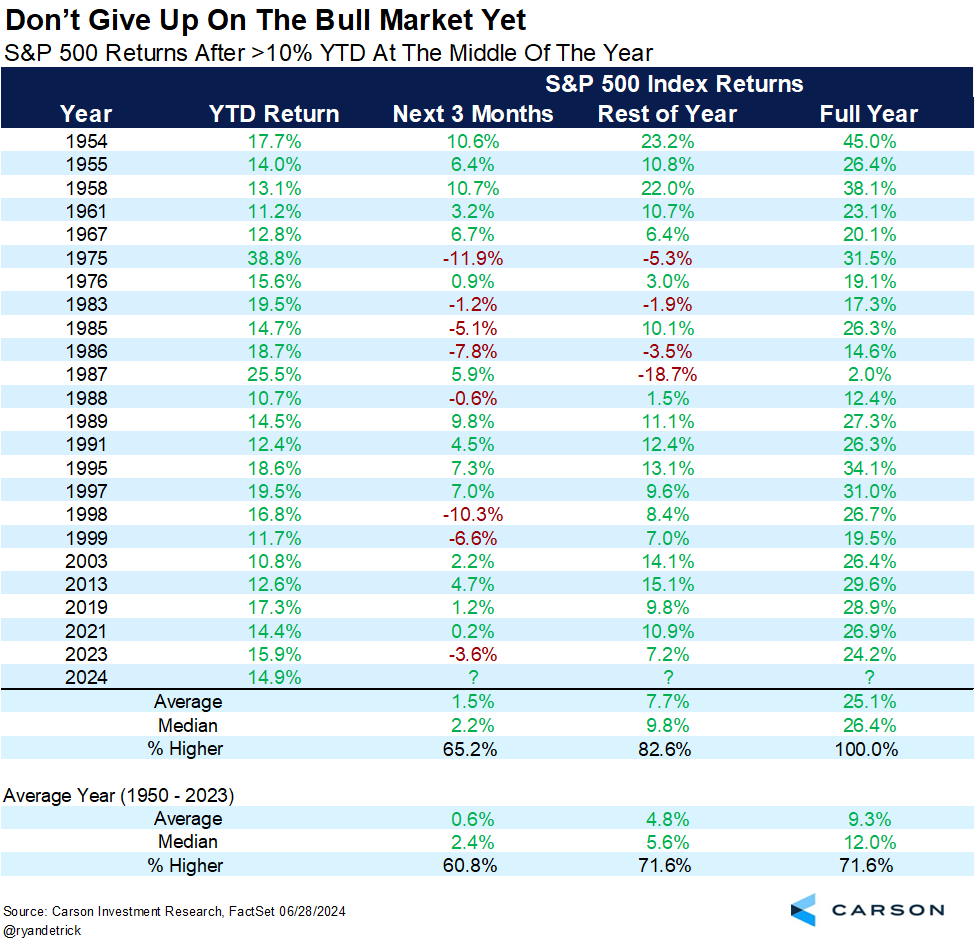
To answer the “where do we go from here” question, the 2H performance is higher <83% of the time, and the overall index is up 100%.
For those looking at the glass half empty, this means that we likely will not completely bleed the 15% returns generated ytd.
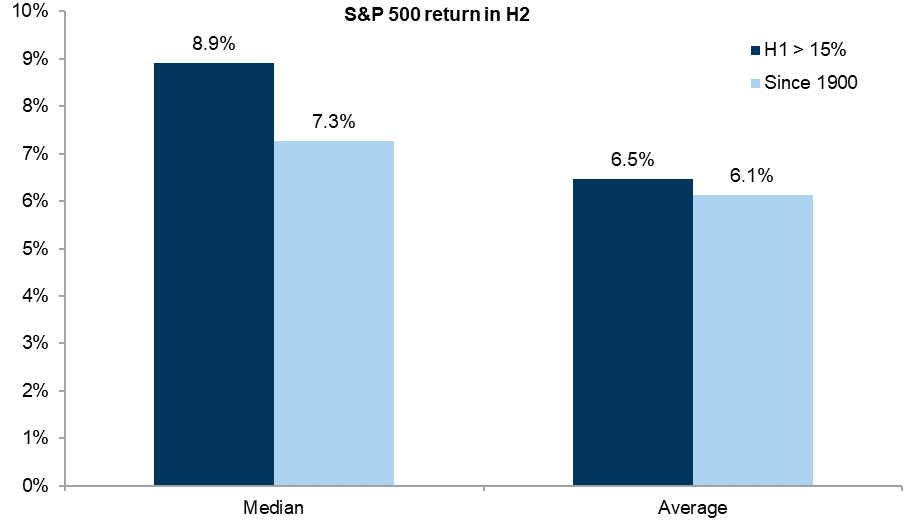
Another cut at the numbers above from Scott Rubner of GS. Either dataset suggests 2H 2024 should be solid.
Also a good time to examine the stocks that have worked thus far in 2024, some of the names are well known, others, not so much, table from Bespoke:
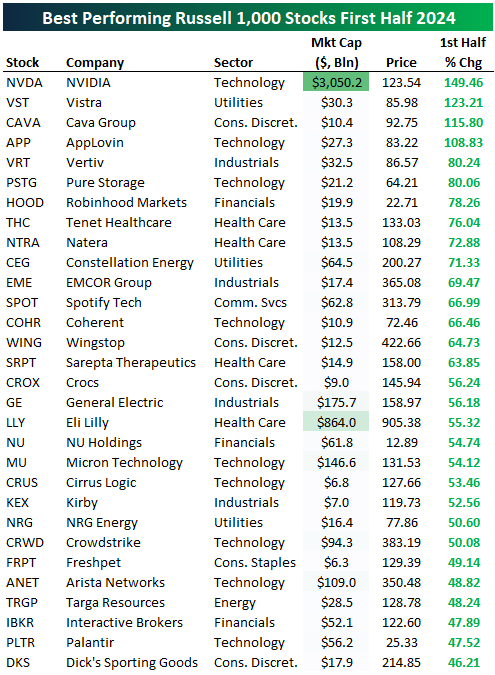
With all of the chatter about the narrow market, interesting that 7/30, or 23% of the stocks on the list are technology. Simply based on press coverage, you would expect the number to be more like 75% don’t you think?
Wingstop and Cava have been absolute beasts, wow!
For me the surprises are: HOOD, KEX, FRPT and THC.
It was a fairly quiet week on the macro front, with releases skewing to the softer side of things. The best evidence of the softer trend can be seen thru the Citi Surprise Index, courtesy of Ed Hyman, EvercoreISI
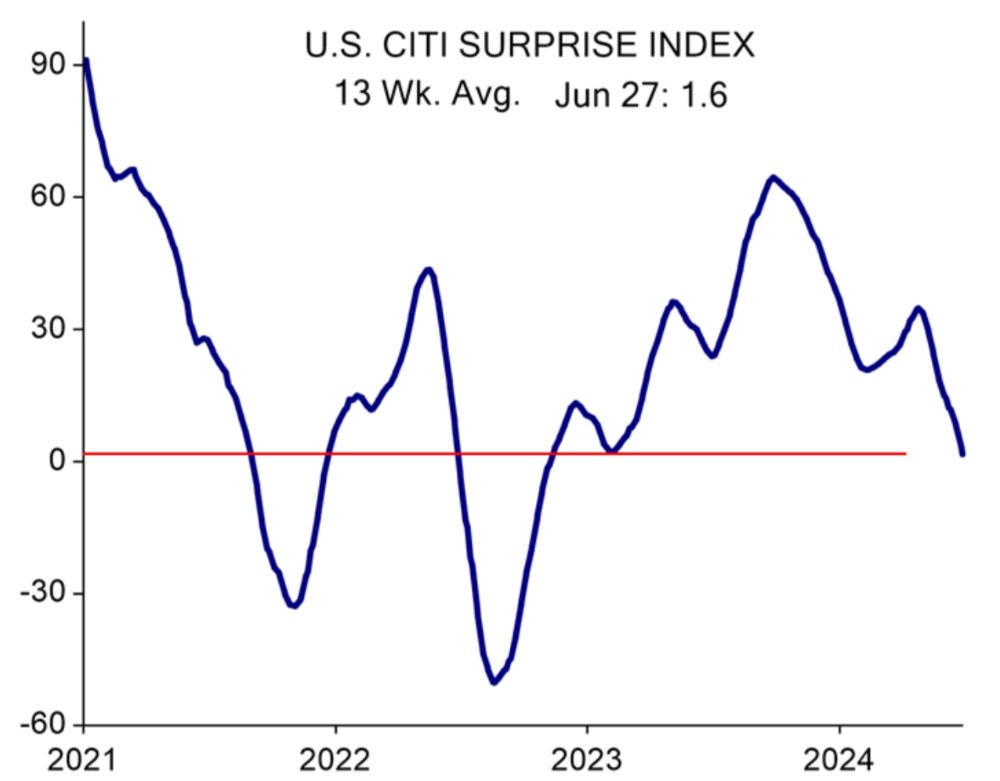
Let’s dig into this week’s market moving releases.
PCE - EVEN BETTER THAN BENIGN CONSENSUS
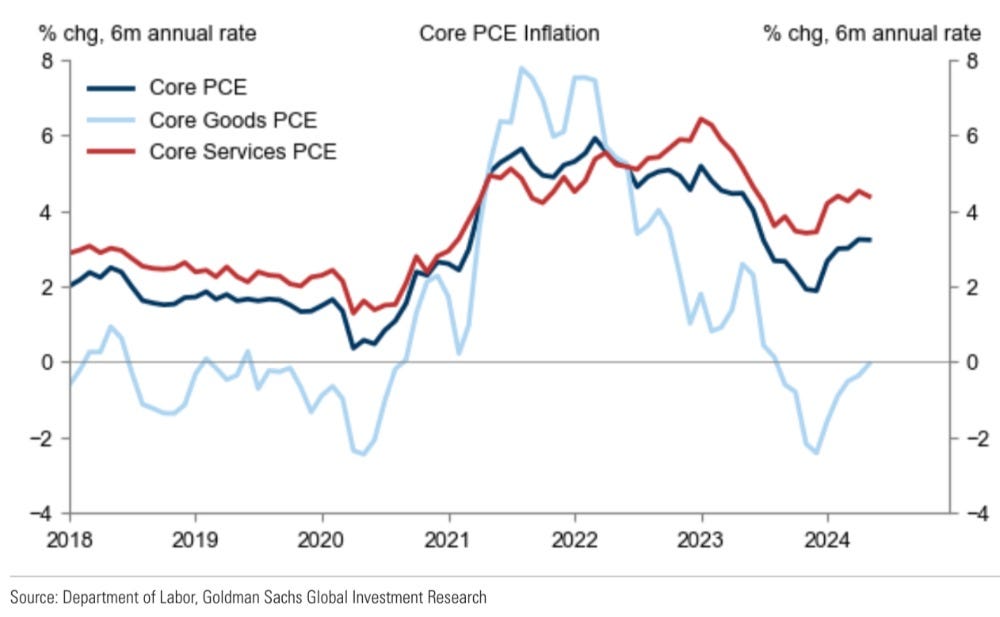
Graph from Jan Hatzius, GS
I like this graph as it uses the oft cited 6-month annualized core PCE measures.
Core PCE registered 0.08% m/m and 2.57% y/y, it’s lowest reading since early 2021.
I would also note that core is now below the Fed’s forecast for end of 2024 of 2.8%, understanding that the dramatic declines from summer of 2023 will make future decreases more of a challenge.
In terms of themes, I would say it was more of the same with goods deflation continuing, and inflation on services remaining somewhat sticky.
Market-based PCE, which has been mentioned regularly by JPow, came in at 0.15% m/m, 2.37% y/y, a solid decline from April’s 2.52% reading.
I think the big question for investors is precisely how many softer PCE readings does the Fed want to see? It is certainly more than one!
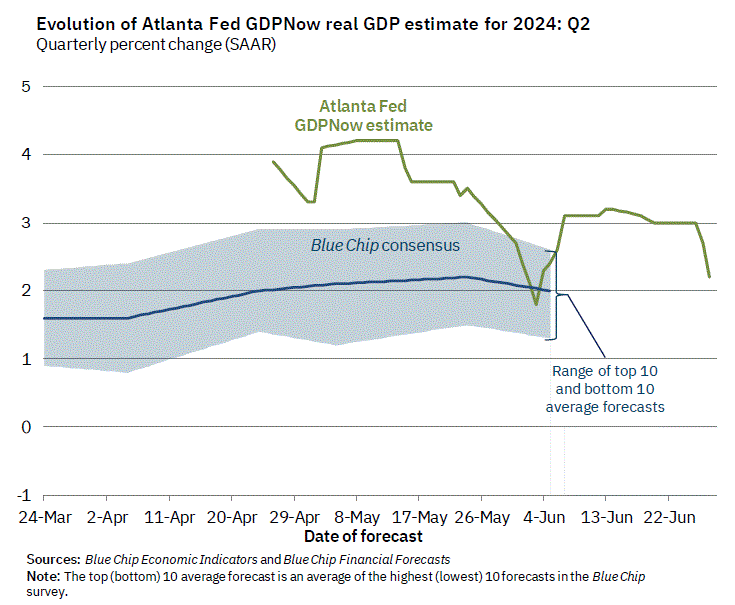
In terms of the consumption data, personal income was slightly stronger and consumer spending was slightly weaker. On balance, combined with the negative revisions to Q1 GDP, it is clear that the US economy and the US consumer is slowing down.
Jan Hatzius and team at GS have left their Q2 GDP estimate unchanged at 1.9%. GDPNow was revised lower to 2.2% from 2.7% based on the updated consumption data released on Friday.
Interestingly odds of a September rate cut didn’t move much this week according to CME Fedwatch, currently sitting at 64%, down slightly from 66% last week.
If you would like to continue reading, please subscribe for $20/month using the button below:
Here’s what’s in store:
Portfolio Stocks - this week I analyze the impact of the recent bank stress tests on my financial holdings and also highlight a space tech name that is on the verge of a breakout.
Charts of the Week - as I mentioned above, several examples of spikey moves (both up and down) along with continued M&A inspired activity.
Flows - there was a massive technology inflow last week, did it continue? And where is the smart money putting $$ to work?
Macro - outside of PCE, there were a few other data points that support the soft landing narrative.
If this is it, thanks for reading and good luck with your investments this week!
You can follow me on X (@NSLInvestments) or LinkedIn Jonathan Lansky LinkedIn or you can look for posts on the Chat feature of Substack.